From Vibe Coding to Deal Intelligence: How One LA Broker is Quietly Building a Tech Edge

From Vibe Coding to Deal Intelligence: How One LA Broker is Quietly Building a Tech Edge

From Vibe Coding to Deal Intelligence: How One LA Broker is Quietly Building a Tech Edge

The barrier between “having an idea” and “having a working tool” has essentially collapsed. Most commercial real estate brokers haven’t noticed yet. Jim Klein has.

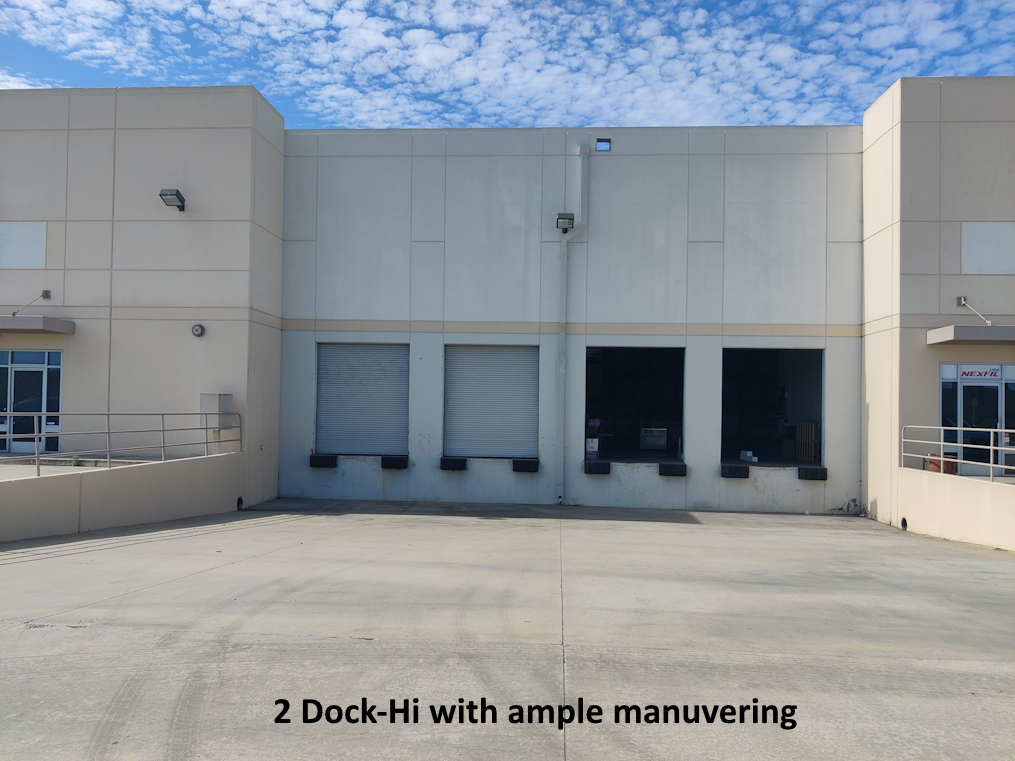
Klein, an industrial real estate specialist in the Los Angeles market and a seasoned SIOR member, has spent the past stretch of time doing something most brokers his caliber rarely do: building his own technology stack. Not by hiring developers. Not by purchasing enterprise PropTech subscriptions. By sitting down with AI tools and describing, in plain English, exactly what he needs and watching functional software materialize in response.

It’s a practice gaining traction in tech circles under the name vibe coding, and it may be one of the most underappreciated skill sets a commercial broker can develop right now.

The Broker-Builder

There’s a new archetype emerging in commercial real estate. Not a technologist. Not a software entrepreneur. Just a seasoned practitioner who got curious, leaned in, and discovered that building useful tools no longer requires knowing how to code.

Vibe coding works exactly the way it sounds. You describe what you want to an AI. The AI writes the code. You refine it through conversation. You deploy it. The “coding language,” as Jim puts it, is basic English and that’s precisely what makes it accessible to anyone willing to try.

He offers one honest caveat worth passing along: having someone with a programming background nearby during those early sessions helps clear the initial hurdles. The fundamentals of how scripts connect to platforms and APIs aren’t always intuitive the first time. But once you’re past that threshold, the playing field levels quickly and the possibilities expand fast.

Two Platforms, Two Distinct Superpowers

What makes Jim’s approach particularly instructive isn’t just that he’s using AI. It’s how deliberately he’s matched the right tool to the right job. He’s built a two-platform intelligence system, each one purpose-designed for a different dimension of his business.

Gemini: The Market Radar

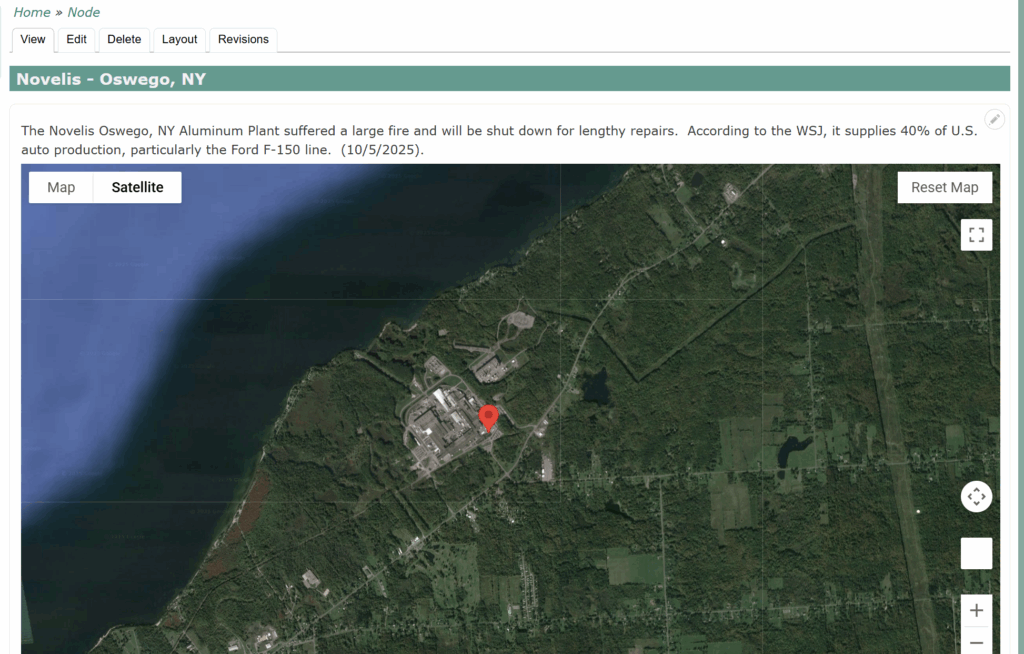
Jim has configured Google’s Gemini as a live intelligence feed for the industrial sector. Every day, it pulls news from sources around the globe, publications and Google Alerts he’s personally curated, and filters everything through a custom keyword ranking system. Words like expansion, growth, layoffs, WARN notice, and default trigger prioritization, automatically surfacing the stories most likely to signal a leasing event, a distress opportunity, or a tenant in motion before the broader market catches on.

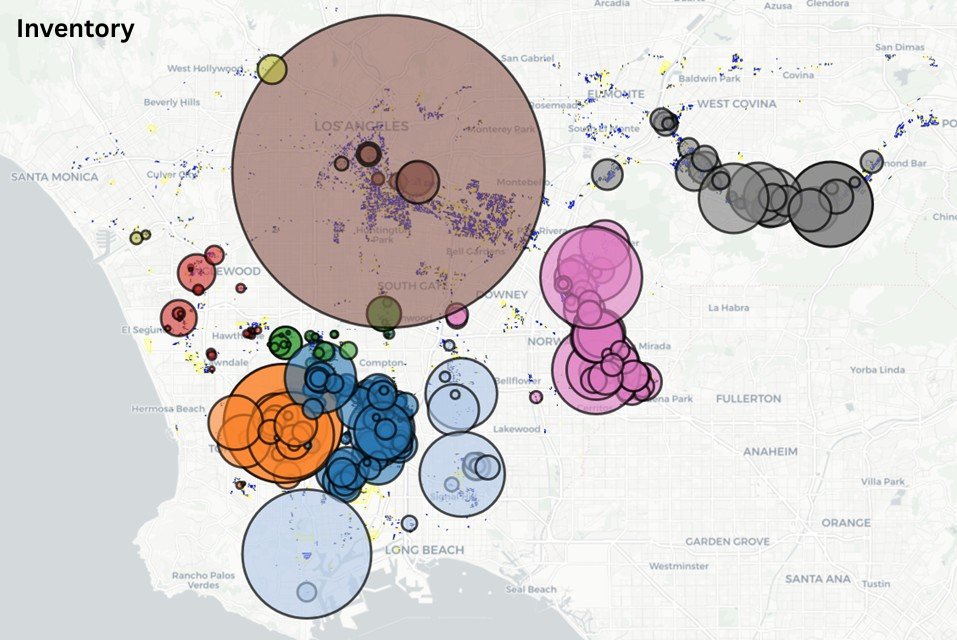
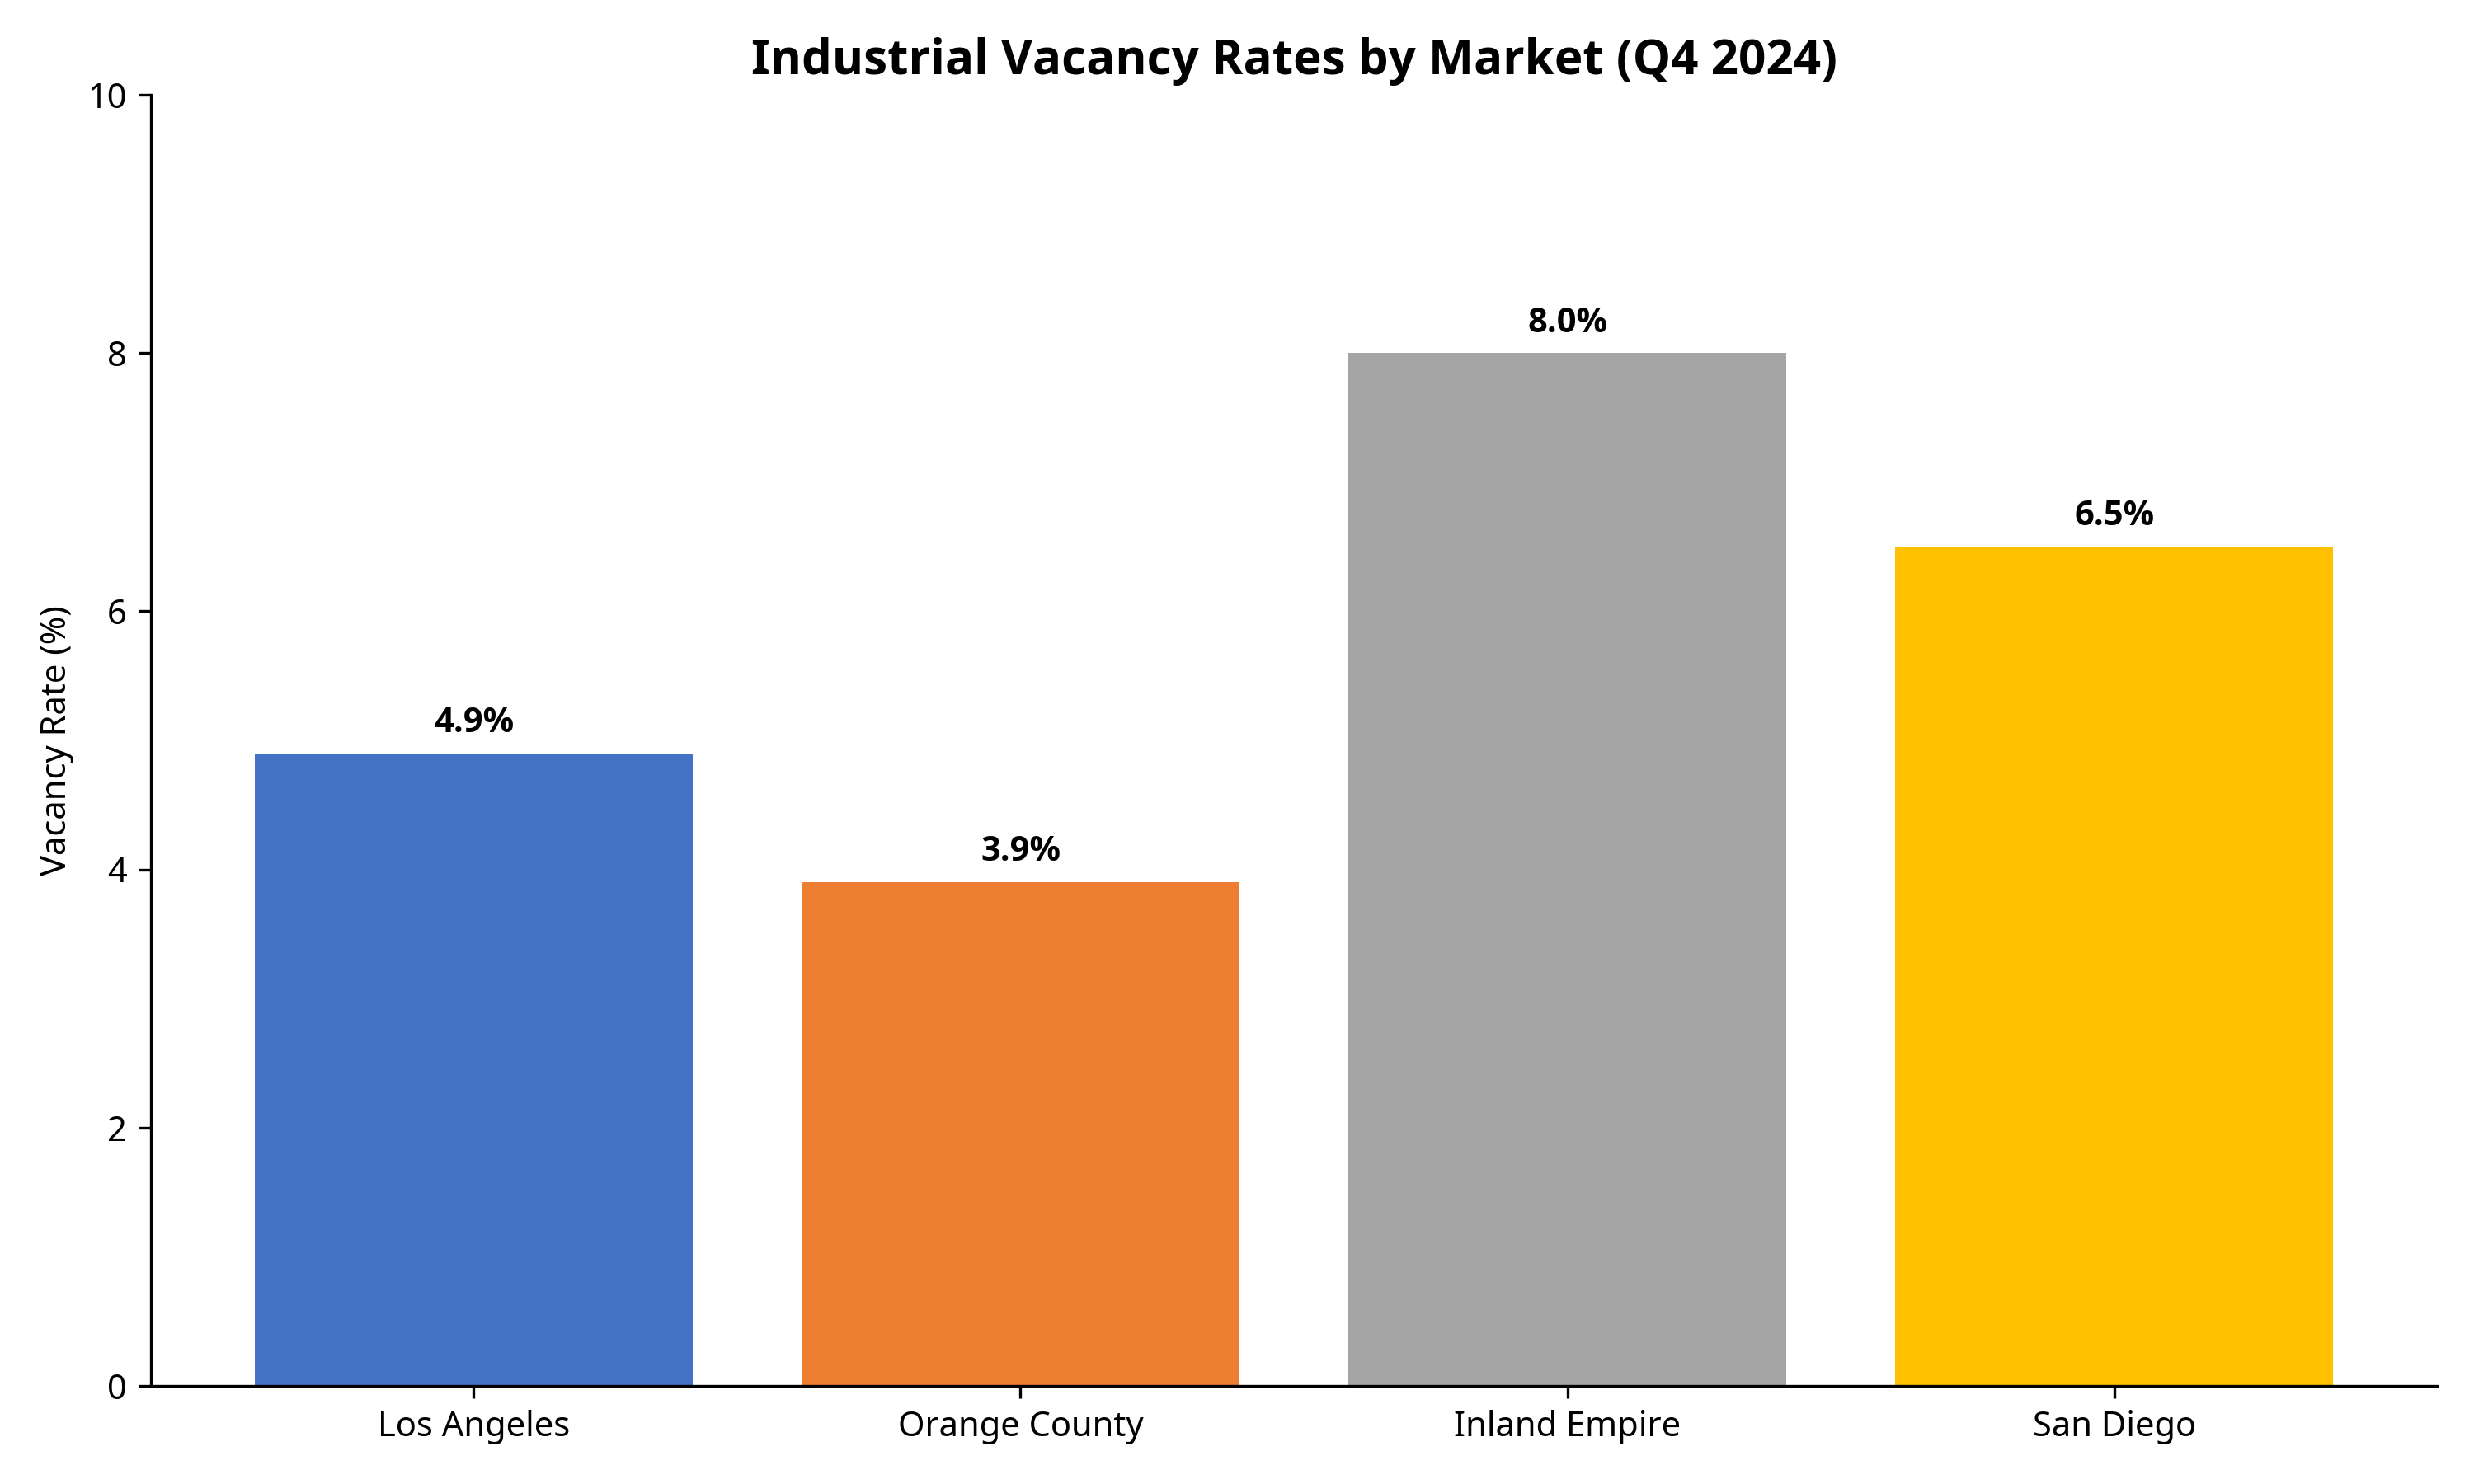
What elevates this beyond a standard news aggregator is the Google Maps API integration. Every story arrives with precise location data attached. A logistics company announcing expansion in the Inland Empire isn’t just a headline. It’s a pin on a map, a radius search waiting to happen, a prospecting call that can be made before a competitor has even seen the news.

The infrastructure behind all of this? Google Workspace. Gmail. Sheets. Calendar. Docs. Tools every broker already has open on their desktop every day. What Jim discovered, and what most brokers haven’t yet, is that every one of these tools has script extensions that can be unlocked through AI-generated code. You describe what you want. The AI writes the script. When something breaks, it debugs itself.

The entire workflow is built on tools you already pay for. The only new ingredient is knowing to ask.

Claude: The Market Intelligence Engine

The second platform in Jim’s stack is Anthropic’s Claude, and here the application shifts from market surveillance to deep market knowledge.

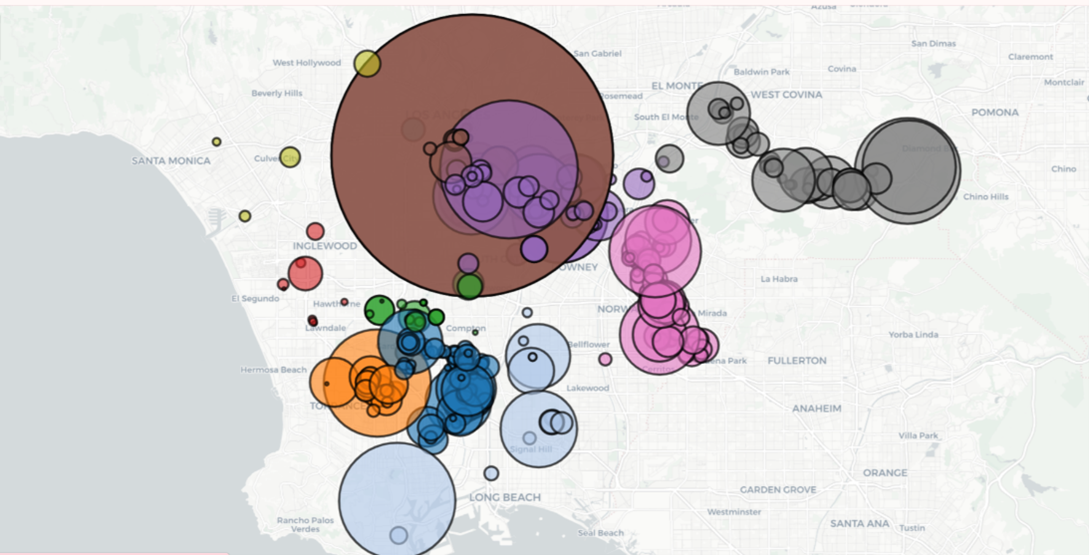
Jim has loaded Claude with Los Angeles parcel data and market comparables, effectively transforming it into a conversational database that would have required a dedicated GIS analyst to replicate just a few years ago. From anywhere, including the field, he can ask:

  • “Who are the closest building owners within 1,000 feet of this address?”
  • “How does our listing compare to everything available within a one-mile radius?”
  • “Who owns 123 Main Street?”

Answers come back in seconds, often with maps generated on the fly. And this is just the beginning. CRM data integration is next on Jim’s roadmap, meaning contact history, deal activity, and relationship context will soon layer directly on top of the parcel and market intelligence already in place.

This is what a true deal intelligence platform looks like when it’s built by someone who actually understands their market, not by a software company making educated guesses about what brokers need.

The Question Every Broker Should Be Asking

Jim frames the real challenge with characteristic directness:

“How are you making more deals with AI?”

Not “Are you using AI?” By now, almost everyone can check that box in some form. The sharper question is whether AI is actually changing your deal count, your deal quality, or your competitive position. That requires a different level of intentionality than having a ChatGPT account you open occasionally.

Jim’s framework offers a useful benchmark. His AI stack is:

  • Proactive, not reactive. It surfaces opportunities before he goes looking for them.
  • Location-aware. Every piece of intelligence is anchored to geography.
  • Integrated. Tools communicate across platforms he already uses daily.
  • Field-ready. It works when he’s standing in front of a building, not just when he’s back at his desk.

That’s not a technology experiment. That’s a competitive infrastructure.

The Window Is Open, But Not Forever

The early adoption advantage in AI-powered brokerage workflows is available right now. But windows like this don’t stay open indefinitely. The brokers who will look back on this moment as a turning point are the ones treating AI not as a novelty, but as infrastructure to build on. Quietly. Deliberately. Deal by deal.

Jim Klein’s example makes one thing clear: you don’t have to wait for a PropTech company to package this into a product. You don’t need to hire a developer. You need curiosity, a willingness to experiment, and maybe one person nearby who’s been around code before.

The rest, it turns out, you can figure out in plain English.

Jim Klein, SIOR, is a commercial real estate broker specializing in the industrial market in Los Angeles. His work in AI-integrated market intelligence reflects a growing movement among top practitioners applying practical technology to generate measurable business results.


Introducing Mr. Warehouse

Introducing Mr. Warehouse

THE NEW ALIGNMENT: INDUSTRIAL REAL ESTATE IN 2026

A Three-Part Series introducing Mr. Warehouse.

PART 1: Global Logic, Local Intelligence, and the AI Edge

In my early days in the industrial real estate business, information was physical. Listings were delivered in three-hole-punched books, an inch thick, and we were “farm brokers” tethered to small, tightly drawn sub-markets in Los Angeles. If you stepped out of your boundary, you had to bring in a partner who worked that different turf. It was an era of high friction, but it birthed the deep local specialization and clients that stayed with me for decades.

Today, we are in a New Alignment. Two massive shifts are happening simultaneously: a geopolitical fracturing where U.S. bloc industries are “friend-shoring” away from traditional offshore centers, and a technological revolution where AI is partnering with humans to lead us to new directions. A major underpinning of the business, the agency relationship, will diminish as a transaction mindset takes hold. We are facing a reconfiguration of the industrial real estate business.

AI: The Lens for a Fractured World

The New Alignment allows us to have a global view that was previously impossible for a local broker. By mapping industrial infrastructure and supply chains within and across borders, we can see the “fracture” in real-time. Through our domestic and international network of SIOR brokers, we aren’t only looking at filling vacancies; we are examining how a specific property fits into a resilient global network. AI allows us to move beyond the “farm” mentality and into a high-level global network.

The Paradox: Better Global Tools, Better Local Intelligence

A side effect of this shift is that global tools and perspectives make us more aware of the local level. Even as we monitor global trade and production, these same techniques provide a sharper, more granular understanding of our home market. At Mr. Warehouse, we update our location mapping and pricing graphs for the Greater Los Angeles area monthly and offer these analytics to our partners in other markets. It’s a vast improvement from the days of weekly listing books.

AI opens new industrial real markets to explore. And by using what we learned locally, we can partner with our global colleagues to achieve what we couldn’t do alone.


PART 2: Industrial Infrastructure for the New Alignment

In the “farm broker” days, our data was fixed in a physical book. Today, our data lives with tools that capture intelligence. In the New Alignment, we don’t look only for real estate – although through that is the primary means we are compensated; we look for meaning in infrastructure, supply chain, humanity and how that fits into a model of production and distribution. We measure a central principle in the real estate business – location, location, location – and its impact on finance, operations, and the intangible.

Mr. Warehouse adopts three layers of data. These tools allow us to map out the market with precision, helping occupiers and investors find the “nodes” that will thrive in a fractured economy.

Layer 1: The Infrastructure Map (Drupal & Parcel Data)

We use the Drupal Geofield module as a simple way to store and map industrial infrastructure location data. The map visualizes location and geographical relationships. By feeding high-resolution parcel-level, ownership and location into the map, we create a transaction platform not only around availabilities, but proximities.

Layer 2: The Logic of Localization (Streamlit & Analytics)

Once we create the physical map, we apply a layer of logic using Streamlit, an analysis software that uses a property database to calculate physical and value relationships for the purpose of making transactions. We turn raw data into meaning. For instance, our Los Angeles industrial data will show the closest and most optimum properties to move. For an occupier, this layer shows if a given site will optimize their supply chain or if they need to replicate their business, or a part of it, in a more efficient manner or hub.

Layer 3: The Organic Network (The Social Layer)

The most powerful data structure we have isn’t digital—it’s human. After 45 years in the business, with most of those years as an SIOR and attending over 65 conferences, our network of relationships is a living social map domestically and internationally. We use modern social networks and our Global SIOR partners to enhance our technology. It’s a privilege for me to work with the best in the business. This layer turns “data points” into “handshakes.”


PART 3: Proven Strategies, Intelligent Tools

In the industrial real estate business, the fundamentals haven’t changed in nearly half a century. Location is primary. Occupiers will always want to improve their business. Investors want a reasonable financial reward for taking on real estate risk. What is changing is how humans use machines and how artificial intelligence can serve, not as a tool, but a guide.

The Shift Toward Transactional Excellence

As we embrace the New Alignment, the nature of the relationship between broker and client is evolving. While State Real Estate Licensing Law emphasizes traditional agency relationships in their education and discipline, the reality for sophisticated corporations and institutional buyers is they want a transactional relationship. Clients want high-level intelligence, execution and data-informed results over traditional handholding. We always operate within agency law and focus on transactional success with the speed and precision.

The Human Partner in a Digital World

We are utilizing a sophisticated web-and-data stack to achieve these results:

  • AI for Industrial Infrastructure and Supply Chain: We use AI to see the global “fracture” as it happens, predicting where the next major industrial nodes will grow.
  • Parcel Mapping for Relationships: We use deep parcel data to build and maintain personal connections with owners and stakeholders.
  • Global SIOR Collaboration: We collaborate on a personal and regular basis with SIOR colleagues located across the U.S. and the globe.

Conclusion: Understanding the New Alignment.

We use technology to understand location and network relationships under the New Alignment. While global in scope, the local becomes more informed. AI and Fragmentation will lead many of our client to succeed and we want to support them using new technologies and fundamental real estate principles. The New Alignment is a period of opportunity.


Four Types of Industrial Real Estate Decisions

Four Types of Industrial Real Estate Decisions

Four Types of Industrial Real Estate Decisions


For decades, the U.S. industrial real estate landscape was largely shaped by the flow of consumer goods. e-commerce, brick-and-mortar supply chains, and manufacturer distribution networks. This model is not going away and will be enhanced by more e-commerce. However, a profound shift is now underway. New trade dynamics, tax incentives; and support for AI and Data Centers will re-orient location and capital decisions.  There is a new emphasis on factors crucial for enhanced industrial production. This evolution leads to richer set of criteria for assessing location value with an emphasis on network dynamics, supply chain and underlying AI infrastructure.

For companies that are facing real estate decisions, we found the following framework helps you determine the type of move you are most likely to take.  The first three type of decisions are accepted as standard procedures in corporate real estate circles. Infrastructure demands, particularly power, connectivity, and location have grown to being singly important.

  1. Incrementalism
  2. Standardization
  3. Value-based
  4. Infrastructure Dependent


1. Incremental Growth: Remaining close to core operations and seeking nearby buildings to facilitates organic expansion or infill needs. This strategy prioritizes maintaining local expertise and established networks. Incremental growth is the most common way to expand. Value is based on proximity.

2. Standardization: Particularly relevant for companies taking multiple facilities to support regional markets or industries. This approach emphasizes consistent specifications and operational efficiency across a distributed network.Common examples are consumer products, industrial supply, and data centers.


3. Value-Based: Driven by new strategic directions or significant restructuring, this often involves a “Pick Up and Move” to a fundamentally different area, chosen for its long-term alignment with core values and future growth. This frequently occurs when companies leave California for lower costs, fewer regulations or improved synergies with suppliers and customers


4. Infrastructure Dependent: The largest expenditure of industrial development is data centers. Hyperscalers are dependent on huge amounts of power and connectivity on relatively large parcels of heavy industrial land, almost anywhere. Edge data centers are smaller and located in urban centers to serve autonomous vehicles, consumer, shopping, delivery and nearby industrial and commercial facilities.

 To support our clients, we developed these strategies over 45 years. We have custom analytics, self-developed maps and personal relationships across North America and Europe.  Our diagnostics pinpoint the buildings that are right for you. Please contact us with your questions and comments.

Thank you for Subscribing.


204 W. 131st St, Los Angeles, CA

204 W. 131st St, Los Angeles, CA

204 W. 131st St, Los Angeles, CA, 90061

204 W. 131st St, Los Angeles, CA

Industrial Building for Lease – Now Available

  • 11,484 Square Feet Industrial Building
  • Freestanding Building with Private Rear Yard
  • Unincorporated LA County
  • Immediate Access to 110 & 105 Freeways
  • One (1) Ground Level Door – 15’ Minimum Clear Height
  • Two (2) Separate Panels @ 200 Amps 120/240 V Power
  • $11,892 ($1.04 psf) per Month NNN – Additional Expenses Approximately $4,000 ($.35 psf) per Month
  • PDF FLYER

For More Information Please Contact:
Jim Klein, SIOR
(310) 451 – 8121
jimklein@kleincom.com

All information has been obtained from reliable sources, however Property Owner and Broker make no representations as to the information’s accuracy. All tenants and buyers to independently investigate and verify all matters pertaining to the property including but not limited to zoning, physical details, environmental, improvements and any other conditions that affect the Tenant’s or Buyer’s use and occupancy of the property.

Please select a valid form
South Bay (L.A.) Industrial Buildings

South Bay (L.A.) Industrial Buildings

South Bay (L.A.) Industrial Building

Industrial rents have stayed relatively flat except for a spike during the Covid years. Currently, another adjustment is underway due to a reduction of Chinese goods coming through the L.A./L.B. Ports. The Los Angeles region is a gargantuan warehouse market linked closely and dependent on international trade.

The number of sales have fallen to 1/5th of the 2021 peak due to higher interest rates and the inability of investors to use leverage.Occupiers and “tenants-in-tow” have the best opportunity because competition is muted.

Space availability is increasing because of weak demand. International trade is reduced. One segment that is under-supplied is Hard Tech.Buildings require power, offices, security clearances, parking, cleanliness, and a location along the 405 Corridor. Timing is right to re-position buildings in this corridor.

Industrial Clusters

Cluster strategy is used by occupiers to be near skilled employees, vendors, and synergies. El Segundo, the 405 corridor and neighboring cities
is an example of a tech hub led by aerospace and defense. The real estate opportunity is to re-purpose buildings in this area for growing HardTech and Advanced Manufacturing tenants.

More Uncertainty in a Soft Market

More Uncertainty in a Soft Market

More Uncertainty in a Soft Market

As an industrial real estate broker in Los Angeles, we make a living by hustle and personal relationships. Despite our effort, when you step back to analyze, it is the macro influences that are the determinant factors. The Great Financial Crisis drove down interest rates and brought in a wave of institutional investors that purchased almost every available property. These property owners received an additional boost during the Covid period that created a surge of imports and warehouse shortages that increased rents. The economic result was inflation and to combat higher prices, the Fed increased interest rates. This action resulted in reduced investor activity because deals no longer made sense. Now we are facing a Tariff Tantrum that is freezing tenant demand. A few months’ pause in activity wouldn’t be bad except many owners are leveraged and need to service their debt. Each macro event has an unintended consequence on pricing and vacancy.

Los Angeles industrial is particularly dependent on goods coming through San Pedro Bay. During Covid, when there were 100 ships waiting to be unloaded, it created a beneficial rent surge for property owners. Today, with a 70% decrease in port traffic, rents are declining. While obvious in buildings, the clearest example is Industrial Outside Storage (IOS), basically truck yards, which has seen a drop of more than 50%. IOS was the darling of large investors and served as a new property class. However, many of those truck yards remain vacant and were underwritten at much higher rents.

Another source of demand, particularly here in the South Bay, comes from aircraft and defense companies. Its origin in WWII has ebbed and flowed between war and peace. I had one client who made aircraft fasteners and during times of peace, they would store their machinery and lease out the buildings. But during the Korean, Vietnam, and Cold War periods, they would bring out that same machinery and start manufacturing. We are at another similar period with a different breed of defense companies financed by venture capital and not by prime contractors. It’s a growing industry but also hampered by not getting the parts they need from foreign countries. We are also seeing Chinese companies exploring the creation of a manufacturing base in the U.S. with their advanced manufacturing equipment.

You could say it’s the revenge of the private property owner. During the boom period of low interest rates, competition prevented private owners from affordably purchasing property except through investment vehicles with larger funds. Today, private and long-time owners with a low basis can cut their rents and because of Proposition 13, also have low property taxes. For private owners, they merely need to cover their lifestyle while they wait for better times. Large, newly created funds are faced with valuation cuts that can put them out of business. It’s an unpleasant decision to make, but cutting rents is the way to lease buildings until conditions improve. There are simply too many buildings for lease. Long-time property owners have a clear advantage in today’s market until market conditions change. After all, it’s a cycle.

(The Rent and Vacancy charts are supplied by Moody’s Analytics and are based on their data research and forecast methods. However, they do not account for market sentiment based on current tariff conditions and potential of negotiations. Until trade dynamics become more certain, the current sentiment is unfavorable especially for property owners and tenant’s dependent on import and export activity)

14458 S Avalon Blvd, Gardena, CA 90248 – 7350 SF

14458 S Avalon Blvd, Gardena, CA 90248 – 7350 SF

14458 S Avalon Blvd, Gardena, CA 90248

  • 7350 Square Feet
  • Best Small Distribution Space in Los Angeles
  • Two (2) Dock Hi Positions per Unit
  • 2008 Construction
  • 24’ Minimum Clear Height, Sprinklered
  • Concrete Yard Area – 115’ Truck Court
  • Three (3) Bathrooms; Shop Sink; 200 AMPs / 480 V Power
  • Designed for Distribution – 110/105 Intersection
  • $1.57 Gross + $0.08 CAM = $1.65psf all-in ($12,130 per month)

Available Now
PDF Flyer || Site Plan

For More Information Please Contact:
Jim Klein, SIOR
(310) 451 – 8121
jimklein@kleincom.com

14458 S. Avalon Blvd, Gardena

Avalon-Interior-text
Avalon-2DH-text
avalon-office-interior-text

All information has been obtained from reliable sources, however Property Owner and Broker make no representations as to the information’s accuracy. All tenants and buyers to independently investigate and verify all matters pertaining to the property including but not limited to zoning, physical details, environmental, improvements and any other conditions that affect the Tenant’s or Buyer’s use and occupancy of the property.

Los Angeles Industrial Real Estate: Opportunities in the New Tariff Era

Los Angeles Industrial Real Estate: Opportunities in the New Tariff Era

Los Angeles Industrial Real Estate: Opportunities in the New Tariff Era

Introduction

The industrial real estate landscape in Los Angeles stands at a critical inflection point following the implementation of significant tariffs by the Trump administration in early 2025. With Chinese goods now effectively subject to tariffs exceeding 54% and China’s reciprocal 34% tariffs on US imports, the traditional trade flows that have long defined the Los Angeles industrial market are undergoing substantial transformation.

This report examines the emerging opportunities in Los Angeles industrial real estate created by this new tariff environment. While short-term disruptions are inevitable, the combination of reshoring initiatives, supply chain restructuring, and development constraints creates a potentially favorable environment for strategic industrial assets in the region.

Current Market Metrics

The Los Angeles industrial real estate market entered this period of tariff-induced change with the following key metrics:

Los Angeles Industrial Market Metrics (Q4 2024)

Los Angeles Industrial Market Metrics Chart

Source: Cushman & Wakefield Los Angeles Industrial Market Report, Q4 2024

Vacancy & Availability

  • Vacancy Rate: 4.9% in Los Angeles County (year-end 2024)
  • Availability Rate: 6.4% (up from 4.8% one year earlier)
  • Total Direct Available Space: 42.1 million SF
  • Total Sublease Available Space: 9.2 million SF

Rental Rates & Construction

  • Average Asking Rate: $1.39 NNN/PSF/MO
  • Rental Trends: Rates have fallen for five straight quarters but remain 54% higher than pre-pandemic levels
  • New Construction: 6.5 million square feet added in Los Angeles County in 2024
  • Construction Pipeline: Slowing dramatically, with “limited new options in 18-24 months”

Vacancy Rates Comparison

Industrial Vacancy Rates by Market

Source: JLL Industrial Market Outlook, Q1 2025

Tariff Impact Analysis

Impact of Tariffs on Chinese Imports

Impact of Tariffs on Chinese Imports

Chart shows the effective cost increase of Chinese imports after tariffs (base 100 = pre-tariff cost)

Recent Tariff Implementations

  • An additional 34% tariff on all Chinese goods imported into the US (March 2025)
  • Two previous 10% tariff tranches imposed since January 2025
  • Combined with pre-existing tariffs, Chinese goods are now effectively subject to tariffs exceeding 54%
  • China has responded with reciprocal 34% tariffs on all US imports, effective April 10, 2025

Port of Los Angeles Impact

  • Port of Los Angeles Executive Director Gene Seroka predicts a 10% drop in cargo volume in the second half of 2025
  • Every four containers moved through the Port of LA creates one job; a 10% reduction in cargo could impact employment across the supply chain
  • Higher import volume at local ports in early 2025 suggests companies front-loaded imports ahead of tariff implementation
  • Companies are actively reconsidering sourcing strategies, with potential shifts away from China to countries like Vietnam, Indonesia, and Malaysia

Los Angeles Industrial Regions Map

Industrial Regions Opportunity Map

Los Angeles Industrial Regions Opportunity Map

Map shows relative opportunity levels across Los Angeles industrial regions based on tariff impacts and market conditions

The map above illustrates the key industrial regions of Los Angeles County and adjacent areas, highlighting the relative opportunity levels based on our analysis of tariff impacts and market conditions. Regions like Commerce/Vernon show particularly high opportunity potential for cold storage facilities, while the South Bay area presents strong opportunities for last-mile distribution facilities.

Seven Key Opportunity Areas

Opportunity Areas by Relative Potential

Opportunity Areas by Relative Potential

Relative opportunity potential based on market analysis

Opportunity Areas Overview

The intersection of tariff impacts and market conditions creates several distinct opportunity areas in the Los Angeles industrial real estate market:

  1. Last-Mile Distribution Facilities: Smaller, strategically located facilities that reduce delivery times and transportation costs
  2. Manufacturing Conversion Opportunities: Properties suitable for light manufacturing, especially high-tech manufacturing
  3. Cold Storage and Specialized Facilities: Temperature-controlled warehouses for food and pharmaceuticals
  4. Value-Add Renovation Opportunities: Older industrial properties that can be upgraded to meet modern logistics requirements
  5. Strategic Acquisition of Undervalued Assets: Properties near port facilities that may temporarily decrease in value
  6. Alternative Port Strategy Properties: Facilities positioned to benefit from cargo shifting to alternative ports
  7. Data Center Conversion: Industrial properties with robust power infrastructure for AI and cloud computing

Market Timing Considerations

Timeline of Opportunity

Market Timing Considerations Timeline

Timeline showing opportunity levels and key factors across different time horizons

Short-Term (6-12 Months)

  • Supply chains will adjust to tariffs, potentially creating buying opportunities
  • Expect increased vacancy in properties heavily dependent on Chinese imports
  • Potential for price adjustments in certain submarkets most exposed to trade disruption

Medium-Term (1-3 Years)

  • Reshoring initiatives will take hold, driving demand for manufacturing facilities
  • Supply chain reconfiguration will create new demand patterns
  • Limited new development will begin to constrain supply, potentially driving rent growth

Long-Term (3+ Years)

  • New trade patterns will solidify, with Los Angeles maintaining its strategic importance
  • Development constraints from AB 98 will further limit new supply
  • Properties that successfully adapt to new market realities will achieve premium valuations

Strategic Investment Recommendations

1. Focus on Location Quality

Properties with superior access to transportation networks, population centers, and skilled labor will outperform regardless of short-term market fluctuations.

2. Target Flexible Building Designs

Industrial properties that can accommodate multiple use cases will maintain value through market transitions.

3. Monitor Reshoring Announcements

Track major companies announcing US manufacturing investments to identify potential tenant demand patterns.

4. Consider Counter-Cyclical Acquisitions

The temporary disruption in port volumes may create buying opportunities for well-located assets at attractive valuations.

Conclusion

The recent tariff implementations have created a complex but potentially opportunistic environment for Los Angeles industrial real estate. While short-term disruptions are inevitable, the combination of reshoring initiatives, supply chain restructuring, and development constraints creates a potentially favorable environment for strategic industrial assets.

The Los Angeles industrial market’s fundamental strengths—its strategic location, robust transportation infrastructure, and access to one of the largest consumer markets in the country—will continue to support its long-term viability despite the current trade policy shifts.