South Bay Industrial Building Monitor
South Bay, Beach Cities & Long Beach Industrial Monitor
Every industrial building currently offered for lease or sale, all sizes · October 2026 · Space, rents, sale pricing, power and new construction
The headline: the space is big but the buildings are small. Just 58 buildings of 100,000 SF or more hold 42% of all available space, while 329 buildings under 10,000 SF hold only 6% of it. Small space is the tight, expensive end of the market at $1.68/SF for under 5,000 SF, against $1.35 for the largest blocks. Meanwhile 2.9M SF of new product is coming in 19 buildings, nearly all 32–40′ clear with 4,000 amps, into a market where the typical existing building is 18′ clear.
2.2M SFoffered as sublease (53 bldgs)
634 / 221buildings for lease / for sale
≈35%of available SF held by institutional owners
Where the space is
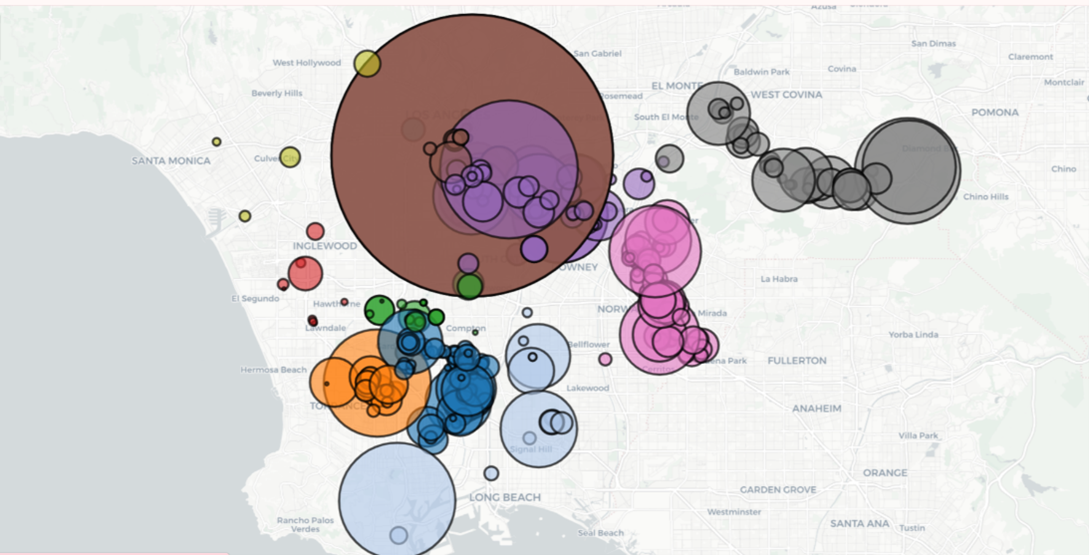
Every available building, sized by available square feet. Orange marks buildings reporting 2,000 amps or more. Dashed outlines are proposed or under construction. Locations are approximate; tap or hover a dot for size, power and offering.
782 buildings shown
Under 2,000A or not reported
2,000A+
Proposed / under construction
By location
Median asking rent and sale price by area. The two “edge” areas sit just outside the South Bay but compete for the same tenants and buyers.
| Area | Bldgs | Available SF | Pipeline | Ask rent | Ask sale $/SF | 2,000A+ | Days listed |
|---|---|---|---|---|---|---|---|
| Carson / Compton / Rancho Dominguez | 179 | 9.9M SF | 470K | $1.39 | $296 (32) | 21 | 190 |
| Gardena / Harbor Gateway | 139 | 3.3M SF | 693K | $1.30 | $250 (41) | 14 | 145 |
| Torrance / Harbor City | 105 | 3.7M SF | 729K | $1.70 | $379 (10) | 11 | 166 |
| LAX / Beach Cities | 91 | 2.1M SF | 407K | $1.95 | $417 (20) | 6 | 175 |
| Long Beach / Port | 140 | 2.9M SF | 459K | $1.50 | $323 (33) | 10 | 214 |
| Mid-Cities / Southeast edge | 89 | 1.6M SF | 101K | $1.27 | $273 (33) | 7 | 146 |
| Culver City / South LA edge | 39 | 816K SF | — | $2.15 | $176 (10) | 3 | 307 |
Rent = median quoted $/SF/month of buildings with a rate. Sale = median asking price ÷ available SF (number of buildings). Days listed = median for existing buildings. Pipeline = proposed + under construction.
Carson / Compton / Rancho Dominguez is the big-box engine, with 9.9M SF available, 40% of the whole market. LAX / Beach Cities and Torrance carry the highest rents ($1.95 and $1.70) and asking sale prices ($417 and $379/SF). Gardena / Harbor Gateway is the value play at $1.30 and $250/SF.
By size
| Available | Bldgs | Available SF | Ask rent (n) | Ask sale $/SF (n) |
|---|---|---|---|---|
| Under 5K SF | 183 | 538K SF | $1.68 (132) | $387 (40) |
| 5–10K SF | 146 | 1.0M SF | $1.50 (89) | $304 (42) |
| 10–25K SF | 190 | 3.0M SF | $1.40 (132) | $286 (46) |
| 25–50K SF | 141 | 5.0M SF | $1.33 (87) | $259 (38) |
| 50–100K SF | 64 | 4.6M SF | $1.36 (33) | $249 (9) |
| 100K+ SF | 58 | 10.3M SF | $1.35 (19) | $283 (4) |
Buildings grouped by space actually offered. Rents are medians; — means fewer than 3 quotes.
Asking rent by area and size
| Area | Under 10K SF | 10–50K SF | 50K+ SF |
|---|---|---|---|
| Carson / Compton / Rancho Dominguez | $1.50 (33) | $1.33 (55) | $1.36 (33) |
| Gardena / Harbor Gateway | $1.37 (37) | $1.26 (47) | $1.18 (6) |
| Torrance / Harbor City | $1.83 (36) | $1.60 (33) | $1.54 (4) |
| LAX / Beach Cities | $1.95 (32) | $1.75 (21) | $2.00 (3) |
| Long Beach / Port | $1.55 (46) | $1.30 (35) | — (2) |
| Mid-Cities / Southeast | $1.38 (26) | $1.19 (19) | $0.99 (3) |
| Culver City / South LA | $2.15 (11) | $2.50 (9) | — (1) |
Median quoted $/SF/month (number of buildings). Larger buildings rarely publish a rate, so the 50K+ column is thin.
By building age
| Built | Bldgs | Available SF | Clear ht. | Ask rent (n) |
|---|---|---|---|---|
| Pre-1960 | 157 | 3.0M SF | 15′ | $1.50 (79) |
| 1960–79 | 316 | 8.7M SF | 18′ | $1.43 (212) |
| 1980–99 | 201 | 5.5M SF | 20′ | $1.50 (149) |
| 2000–09 | 38 | 1.6M SF | 24′ | $1.65 (26) |
| 2010+ | 23 | 2.1M SF | 32′ | $1.85 (7) |
Most available space is in buildings from the 1960s and 1970s. Clear height tracks age closely: 15′ before 1960, 18′ for 1960–79, 20′ for 1980–99 and 32′ for 2010 and later.
Newer buildings ask more, about $1.85/SF for 2010+ product against $1.43–$1.50 for older space, but most new Class A landlords do not publish rates, so few make it into the averages.
Existing buildings only; 28 listings do not report a year built. Clear height is the median of reported maximum clear.
How much power is out there
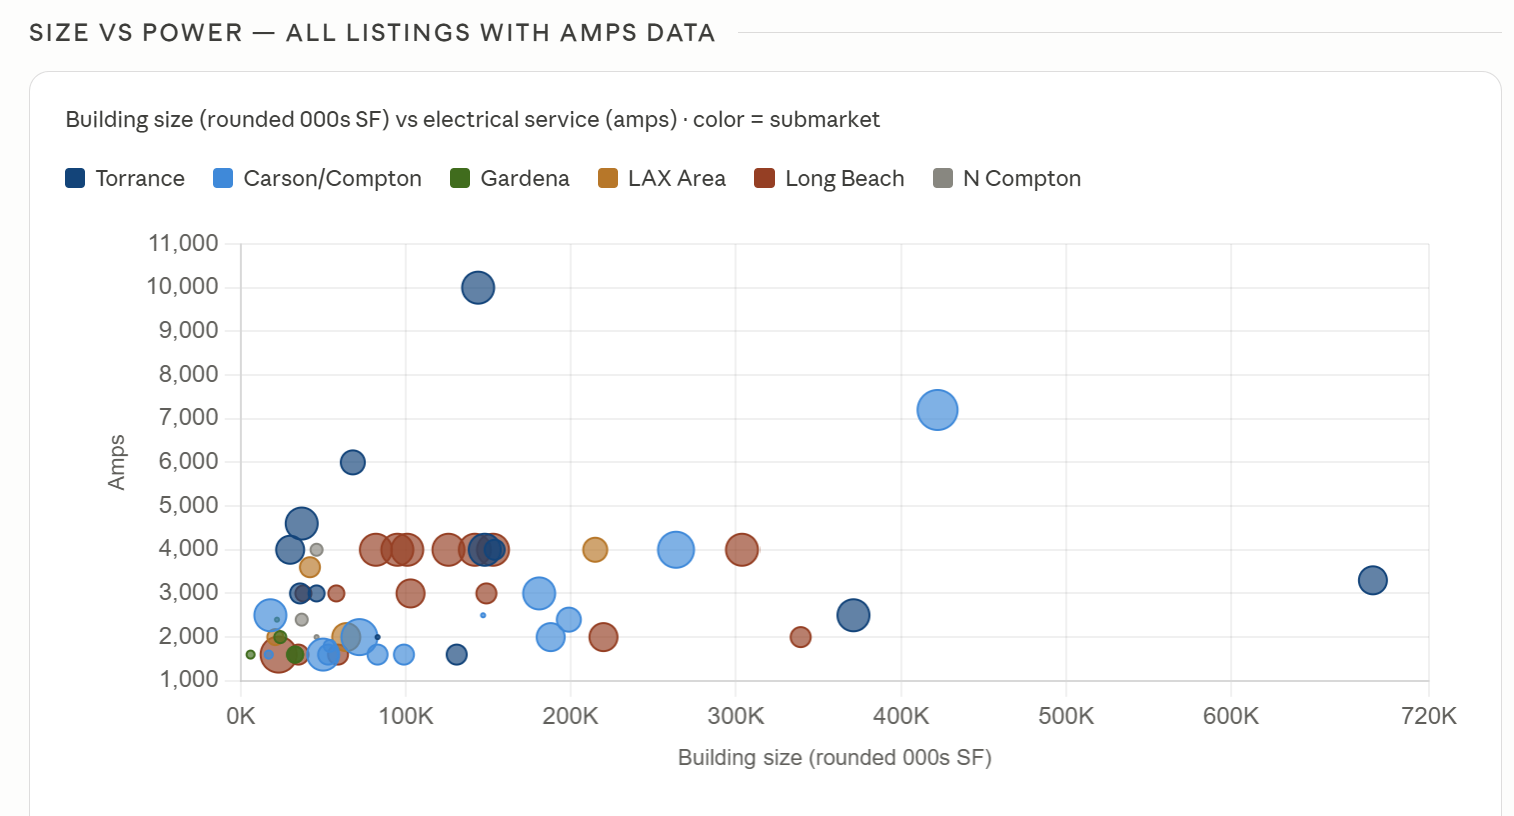
Buildings by reported electrical service (616 of 782 report amps). Orange bars are 2,000A and up.
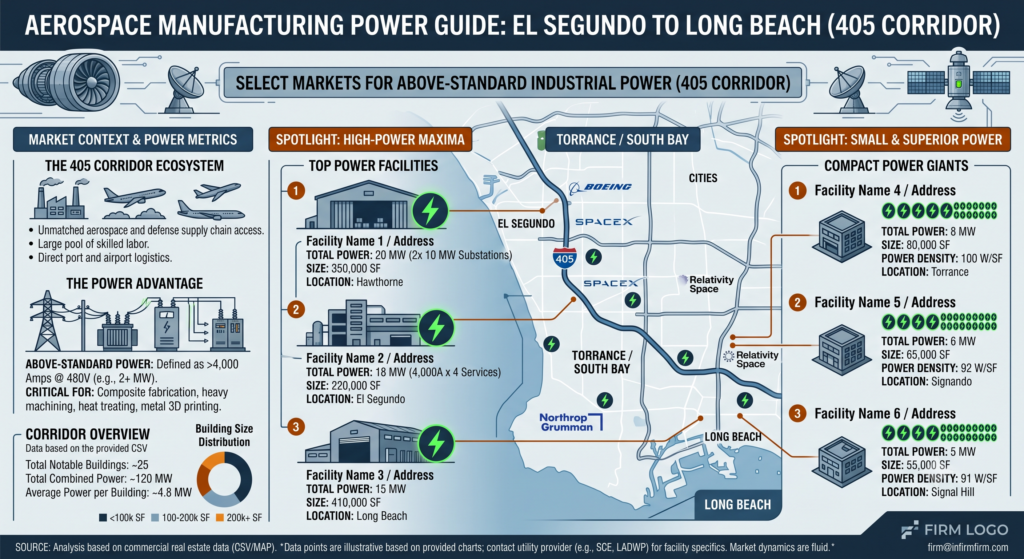
72 buildings report 2,000 amps or more. 58 are existing (5.1M SF) and 14 are proposed or under construction, where 4,000 amps has become standard.
Heavy power is not being priced in. Existing 2,000A+ buildings quote a median of about $1.10–$1.20/SF, below lighter-powered space, partly because they skew larger and older. For manufacturers, cold storage, EV fleets and data-adjacent users, that is the opportunity.
Heavy-power spotlight
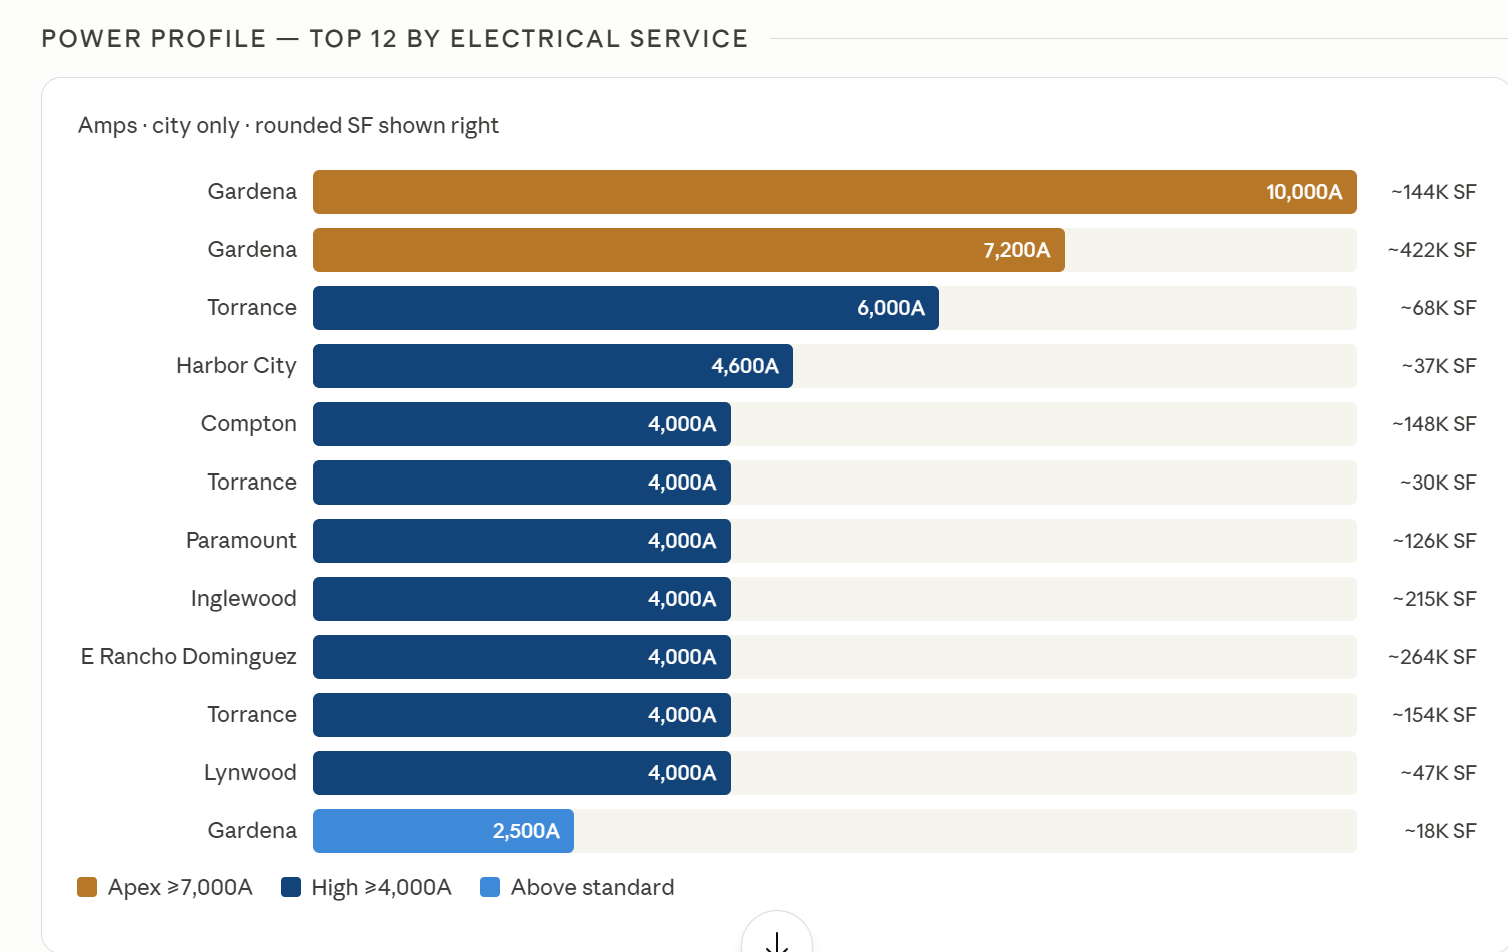
Existing buildings with the largest electrical service. Approximate size and city only; call for details.
| City | Bldg size | Available | Power | Clear | Built | Offering |
|---|---|---|---|---|---|---|
| Compton | ~95,000 SF | ~95,000 SF | 10,000A | — | 2020 | Lease · $0.75/SF/mo |
| Los Angeles | ~165,000 SF | ~125,000 SF | 8,800A | 22′ | 1925 | Lease / Sale · $23.8M |
| Cudahy | ~70,000 SF | ~70,000 SF | 8,000A | 21′ | 1964 | Sale · $14.0M |
| Torrance | ~310,000 SF | ~155,000 SF | 7,000A | 16′ | 1959 | Lease · $1.10/SF/mo |
| Rancho Dominguez | ~70,000 SF | ~70,000 SF | 6,000A | 24′ | 1989 | Lease · Call |
| Harbor City | ~35,000 SF | ~35,000 SF | 4,600A | 20′ | 1969 | Lease · $1.20/SF/mo |
| Carson | ~430,000 SF | ~430,000 SF | 4,000A | 42′ | 2025 | Lease · Call |
| Carson | ~265,000 SF | ~265,000 SF | 4,000A | 28′ | 1977 | Lease · Call |
| Torrance | ~205,000 SF | ~205,000 SF | 4,000A | 30′ | 2000 | Lease / Sale · $102.2M |
| Carson | ~145,000 SF | ~145,000 SF | 4,000A | 36′ | 2018 | Lease · Call |
| Torrance | ~135,000 SF | ~135,000 SF | 4,000A | 32′ | 2020 | Lease · Call |
| Rancho Dominguez | ~100,000 SF | ~100,000 SF | 4,000A | 16′ | 1969 | Lease · $1.40/SF/mo |
New construction
19 buildings totaling 2.9M SF are proposed or under construction, concentrated in Torrance, Carson, Gardena, Inglewood and Long Beach. They will compete directly with the 1970s inventory that makes up most of today’s availability.
| City | Size | Status | Clear | Power | Offering |
|---|---|---|---|---|---|
| Gardena | ~320,000 SF | Proposed | 40′ | 4,000A | Lease |
| Long Beach | ~305,000 SF | Proposed | 40′ | 4,000A | Lease & Sale |
| Inglewood | ~215,000 SF | Proposed | 36′ | 4,000A | Lease |
| Torrance | ~195,000 SF | Proposed | 36′ | 10,000A | Lease |
| Inglewood | ~190,000 SF | Proposed | 36′ | 4,000A | Lease |
| Gardena | ~190,000 SF | Under construction | 36′ | 4,000A | Lease |
| Carson | ~180,000 SF | Proposed | 36′ | 4,000A | Lease |
| Los Angeles | ~180,000 SF | Proposed | 36′ | 4,000A | Lease |
| Compton | ~150,000 SF | Proposed | 36′ | 4,000A | Lease |
| Torrance | ~145,000 SF | Proposed | 32′ | 8,000A | Lease & Sale |
| Torrance | ~140,000 SF | Under construction | 32′ | — | Lease |
| Rancho Dominguez | ~140,000 SF | Under construction | 32′ | 4,000A | Lease |
| Torrance | ~130,000 SF | Under construction | 32′ | — | Lease |
| Cudahy | ~100,000 SF | Proposed | 36′ | 4,000A | Lease & Sale |
| Torrance | ~75,000 SF | Under construction | 32′ | — | Lease |
| Long Beach | ~75,000 SF | Proposed | 32′ | 4,000A | Lease |
| Long Beach | ~60,000 SF | Proposed | 36′ | — | Lease |
| Torrance | ~45,000 SF | Under construction | 30′ | 4,000A | Lease |
| Long Beach | ~20,000 SF | Proposed | 30′ | — | Lease & Sale |
What it means
Users & corporations
With 21.6M SF of existing space and a 179-day median listing time, tenants have leverage on rent, free rent and TI, especially above 25,000 SF. Space under 10,000 SF is the exception, asking $1.50–$1.68. Need power? 58 existing buildings already have 2,000A+.
Owners
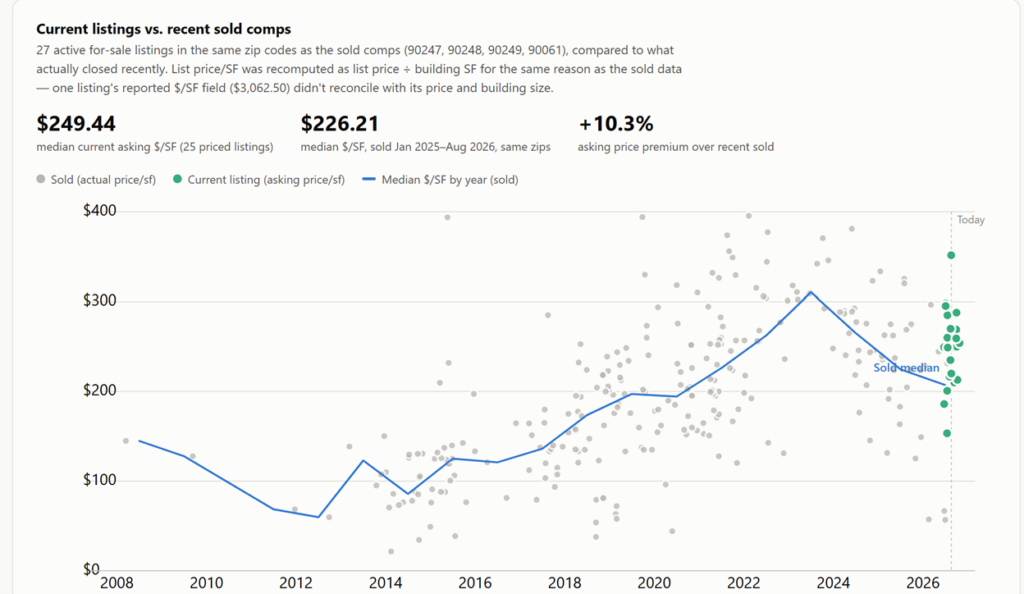
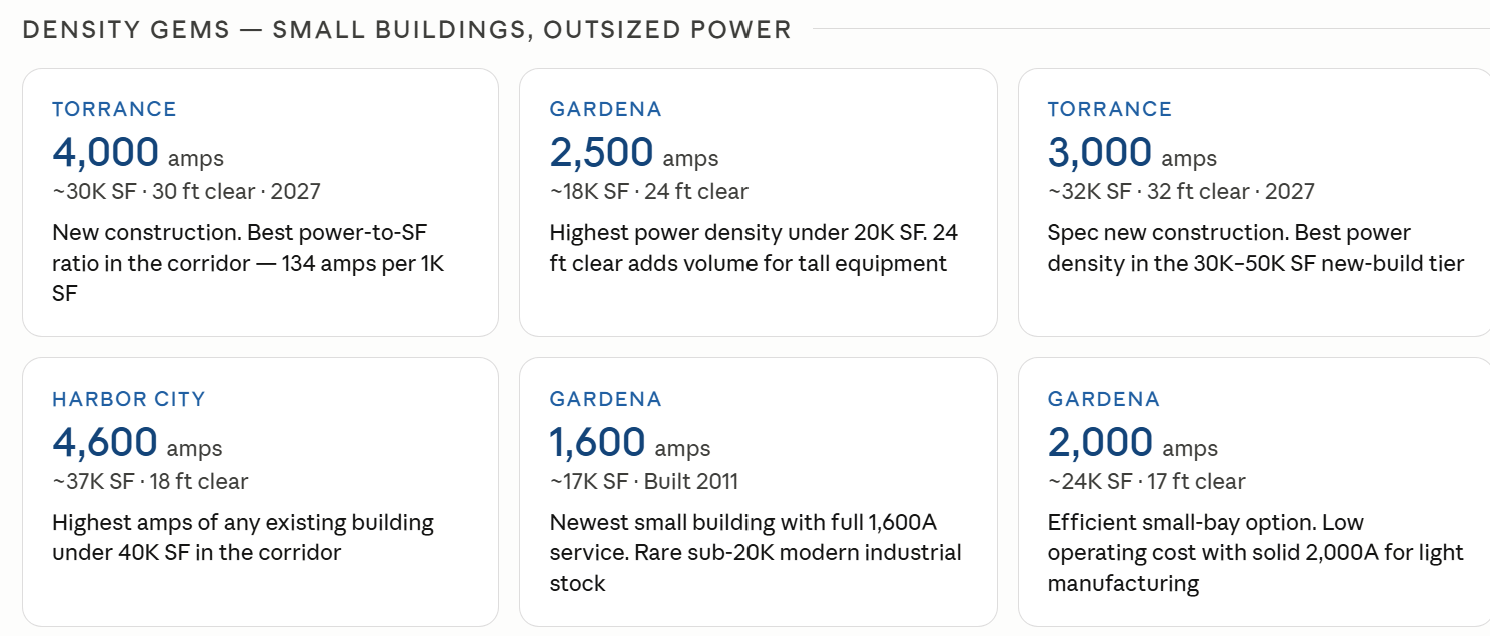
Price to today’s market. Large and older buildings face direct competition from 2.9M SF of 32′+ new construction. Small, well-located buildings remain the strongest product, with 128 for-sale buildings under 25,000 SF asking a median $315/SF (about $2.2M each).
Investors
Asking prices run about $260/SF for buildings over 25,000 SF versus $315/SF for owner-user size. 24 listed buildings carry recorded loans maturing by the end of 2028; watch them for value-add and sale-leaseback opportunities.
Developers
New product is almost entirely 100,000 SF+ big-box. Only two of the 19 pipeline buildings are under 50,000 SF. Infill multi-tenant and small-bay product with modern clear height and heavy power has little new competition.
Want the details on any of these buildings?
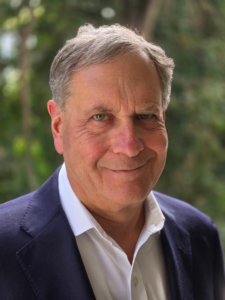
Call or email Jim Klein for addresses, availability and a custom search.
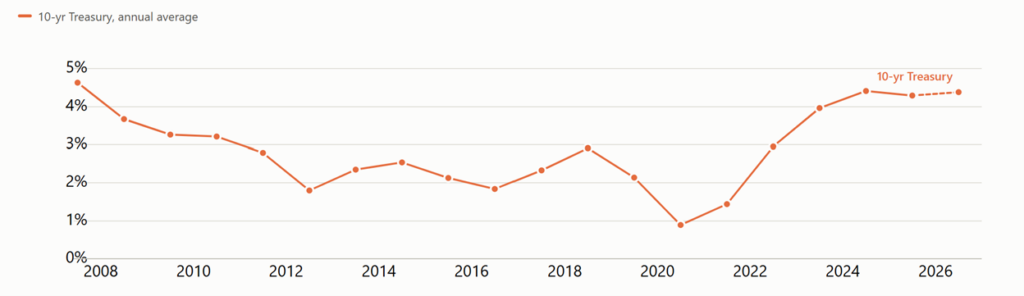
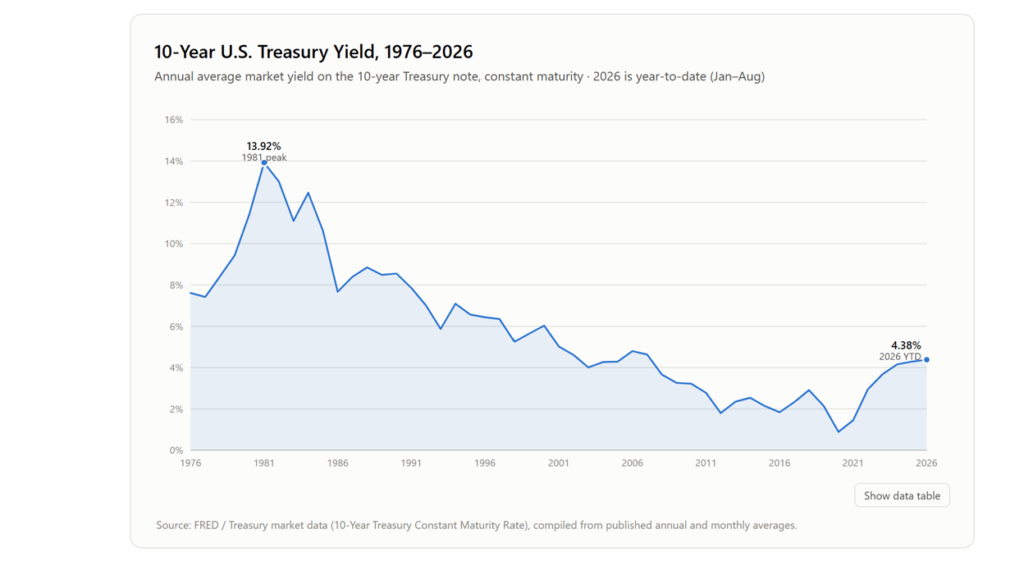 Let us start with treasury bond rates because of the relevance to real estate investors. Treasuries plus a spread determine loans and cap rates. In1981, the year I started in the business, mortgage rates were as high as 18%, and I learned about creative financing. Since that time, rates have been in general decline to where homeowners could borrow under 3%. Over that extended period, buyers and property owners received a continuous rise in property value partially due to the lower cost of finance. Interest rate declines accelerated during Covid to the lowest point in 40 years. This trend fully supported large investors and developers and took the market away from owner/users. Now with interest rates currently re-setting at higher levels, we are at an imbalance because it’s difficult to get satisfactory returns without significantly lower prices. In addition, timelier capital has shifted to other more promising investments, like the AI buildout. A new phrase in real estate, Zombies, are properties that were purchased at the top and can no longer be rented profitably. Capital from the limited partners is tied up and expected redemptions are delayed.