Is This The Time to Find Deals

Is This The Time to Find Deals

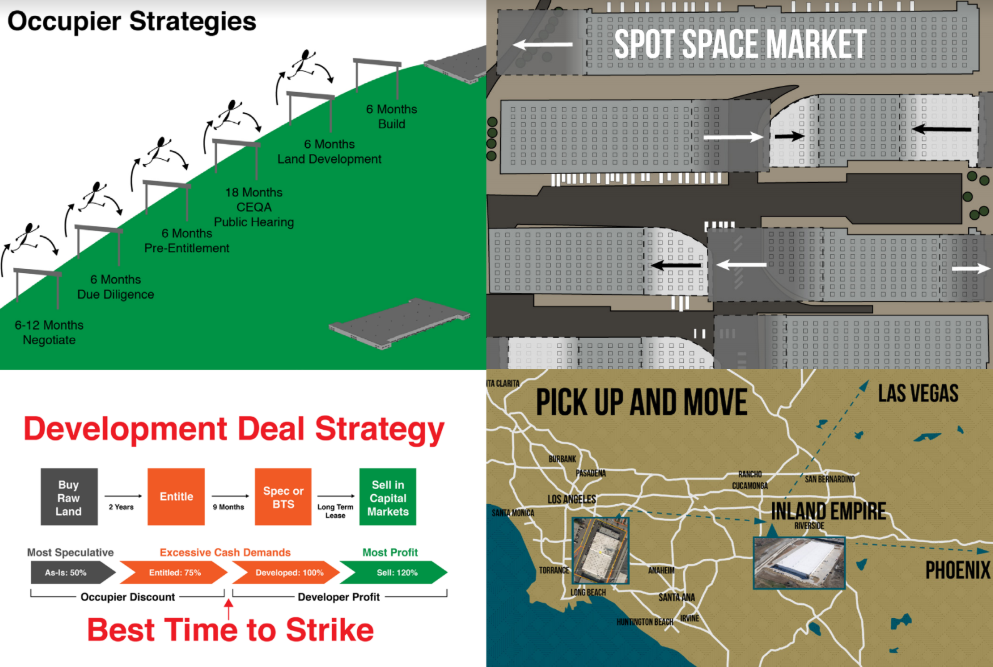
Is This The Time To Find Deals?Let us start with treasury bond rates because of the relevance to real estate investors.  Treasuries plus a spread determine loans and cap rates.  In1981, the year I started in the business, mortgage rates were as high as 18%, and I learned about creative financing. Since that time, rates have been in general decline to where homeowners could borrow under 3%.  Over that extended period, buyers and property owners received a continuous rise in property value partially due to the lower cost of finance. Interest rate declines accelerated during Covid to the lowest point in 40 years. This trend fully supported large investors and developers and took the market away from owner/users. Now with interest rates currently re-setting at higher levels, we are at an imbalance because it’s difficult to get satisfactory returns without significantly lower prices. In addition, timelier capital has shifted to other more promising investments, like the AI buildout.  A new phrase in real estate, Zombies, are properties that were purchased at the top and can no longer be rented profitably. Capital from the limited partners is tied up and expected redemptions are delayed.
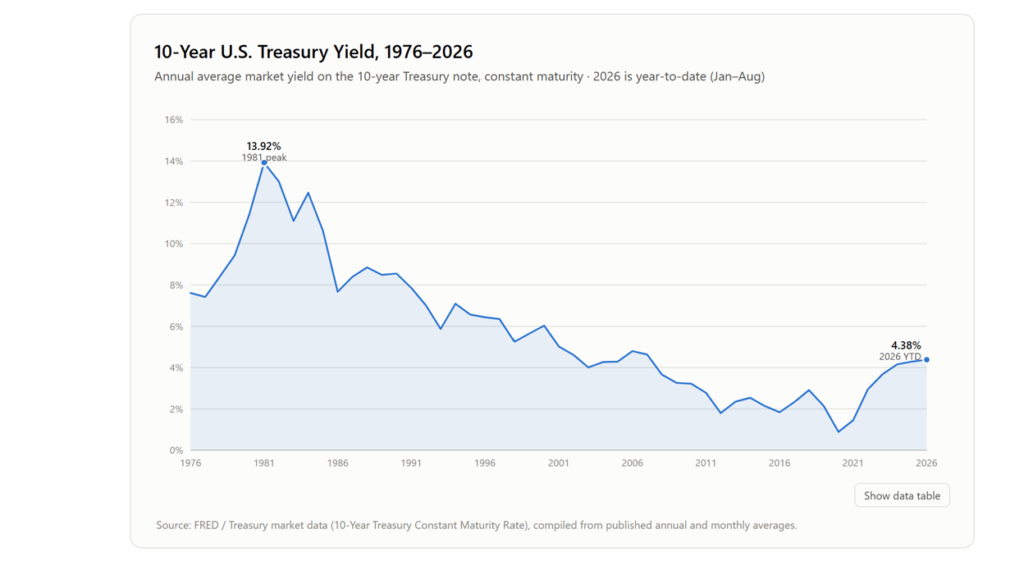
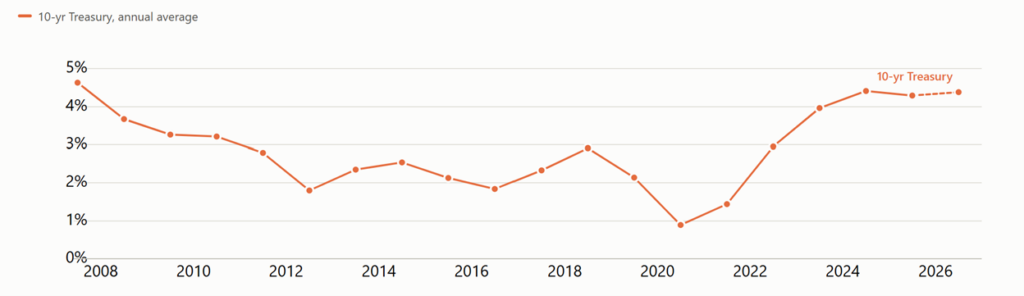
While there is disruption, current interest rates are not abnormal. They are still historically reasonable. The background reasons for higher rates at this point of time could be explained as a reversion to the mean or it could be geopolitical. What is certain is higher rates are not welcome for those who purchased at the peak or are facing a re-finance. It is also true that buyers will be underwriting at today’s interest rates when they deploy new money and that will point to price reductions. Owner/Users, who generally purchase based on comparative occupancy cost and not rate of return, have many more good opportunities than when investors crowded out the market.
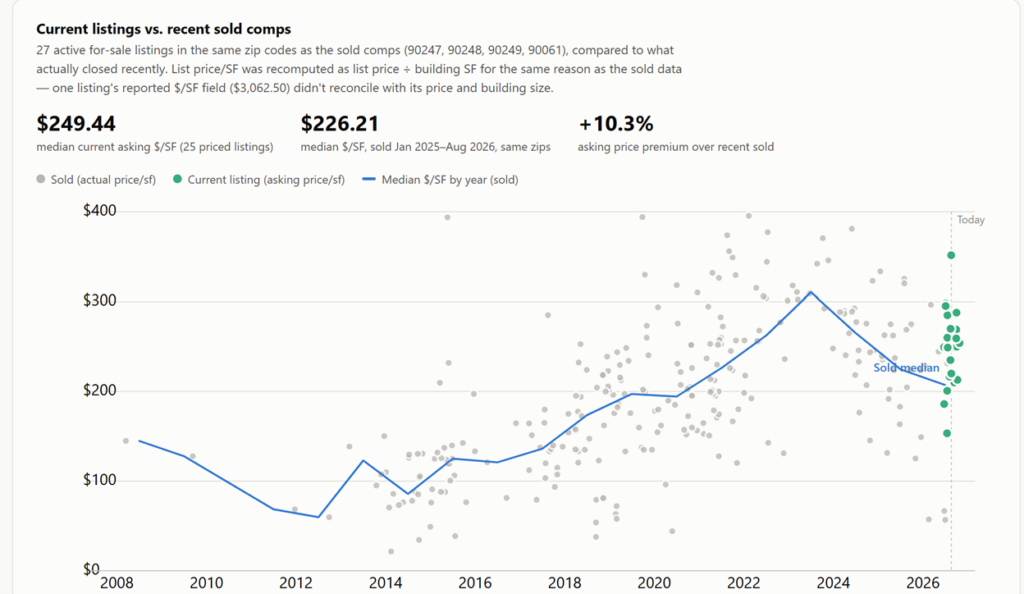
Yes, there are deals today. Sellers feel pricing pressure. Higher cap rates and financing costs, moderating rents, longer vacancy periods, refurbishment, property taxes and insurance premiums all need to be accounted for with any purchase. Currently, there is a standoff between buyers and sellers. Sale prices are declining while asking prices are 10% to 20% higher. Interest rates are key. If they stay steady or go higher, I expect to see softer pricing unless we get a boost in rents, and they are also currently in decline.

Prices Are Down From the Peak
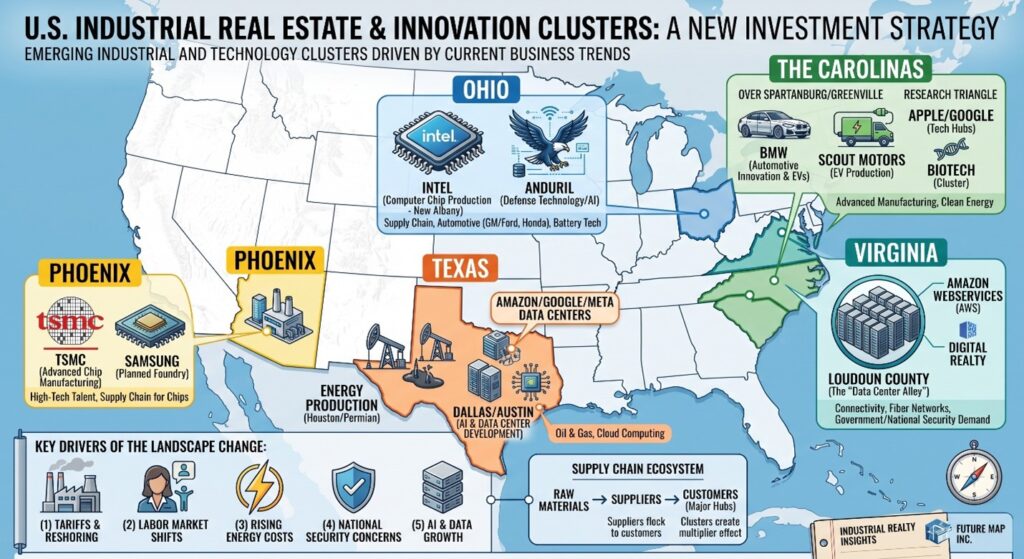
U.S. Industrial Clusters

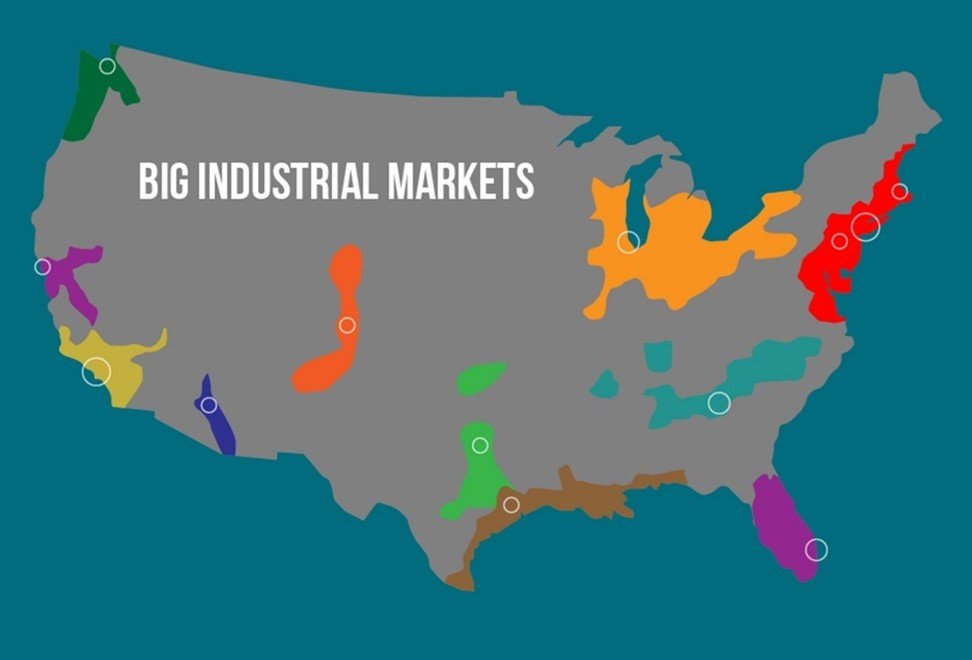
There has been a re-ordering of industrial geography. Gateway industrial markets like Chicago, New York, Dallas, and especially Los Angeles have been primary targets for large investors of industrial real estate. Gateway cities are where goods flow, businesses locate and house large consumer markets for warehouse and distribution facilities. New factors in the business economy have stimulated investment in other regions of the country. If you follow the public and private money, it is going to AI, aircraft, defense, drones, autonomous, materials, energy, pharma, and the industrial supply chains. Proximity to vendors, customers, and labor creates industrial clusters that become part of an industrial building investment theme. A style of investing is developing around industrial clusters. You can see large clusters in parts of Texas, the Carolinas, Phoenix, Virginia, and Ohio. Investment companies and developers are following the movement of these new industrial clusters.
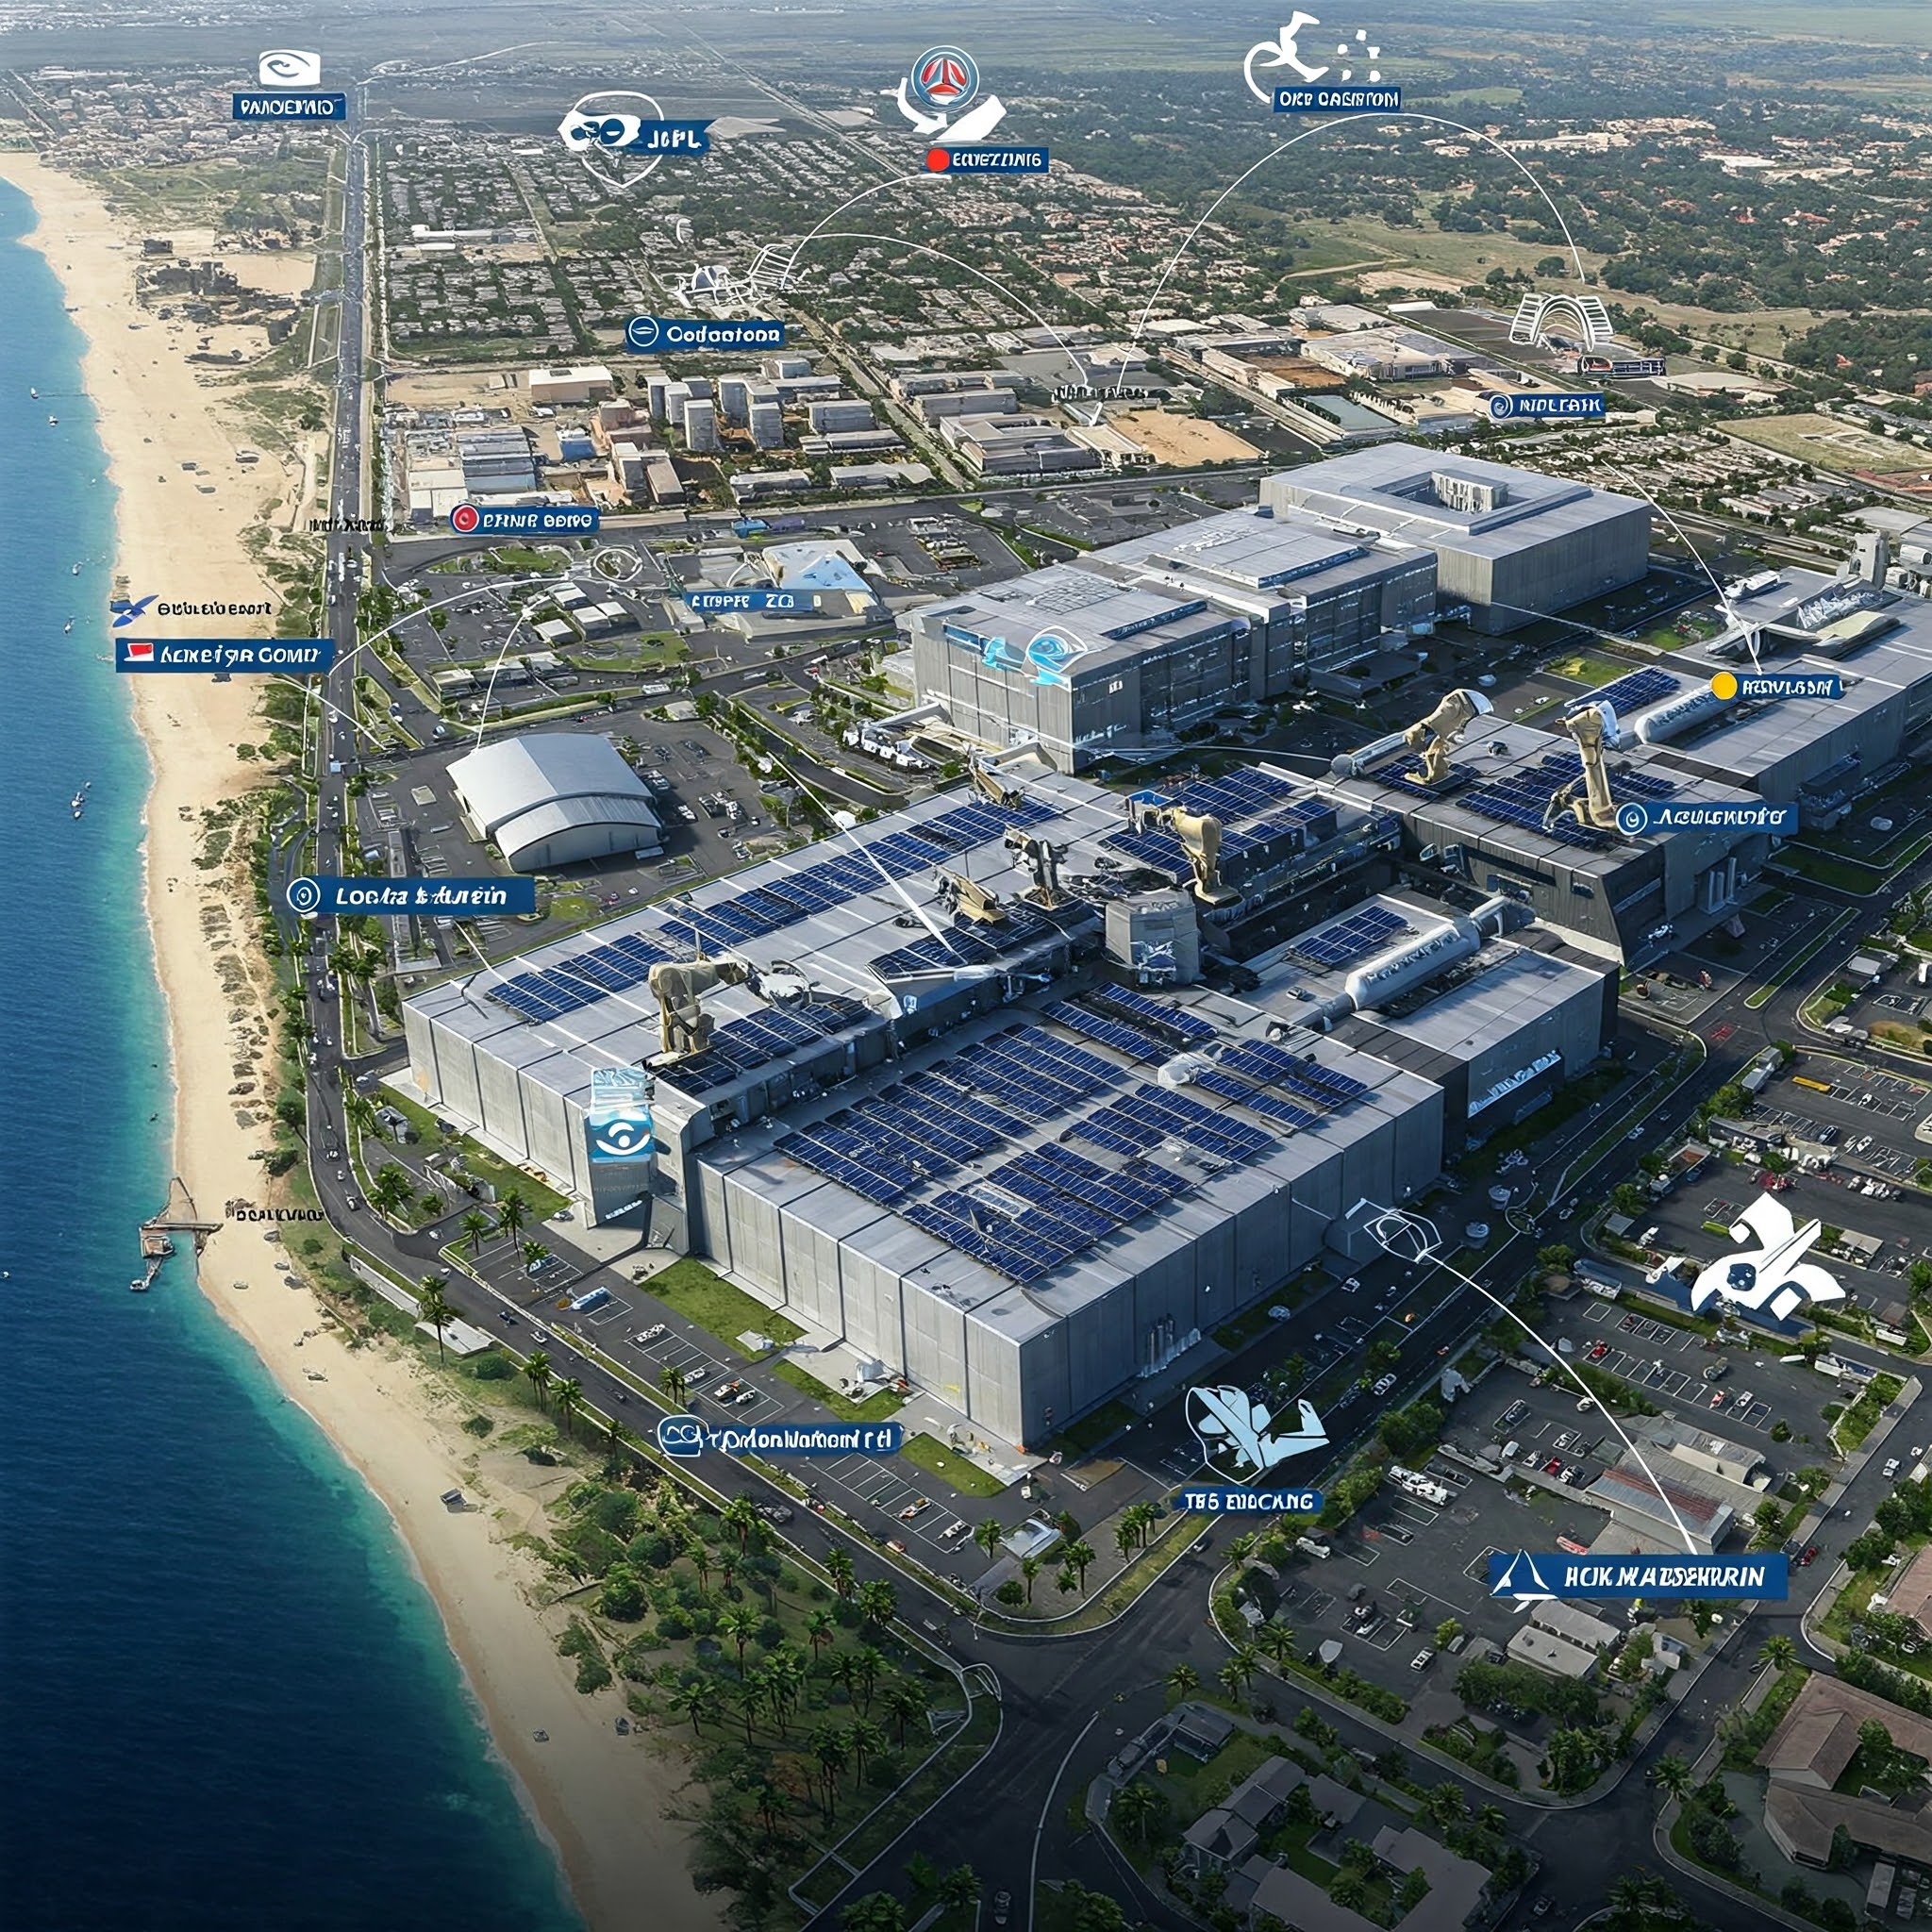
One significant cluster is close to home. Los Angeles the largest Gateway market because of San Pedro Bay. The ports create substantial bulk demand for warehouse and distribution building throughout Los Angeles County and The Inland Empire This can be considered a logistics cluster.  This same geography, the El Segundo to Long Beach corridor, has historically hosted an outsized aerospace, defense, and aircraft defense nexus. To serve growing Hard Tech companies, so-called Advanced Production buildings and refurbished manufacturing buildings, with power, are the current sweet spot. Bulk warehouse has become more commodified, whereas production facilities of the right type and location retain pricing power. Lucky for us we are at the center of both the Gateway and Hard Tech industries.
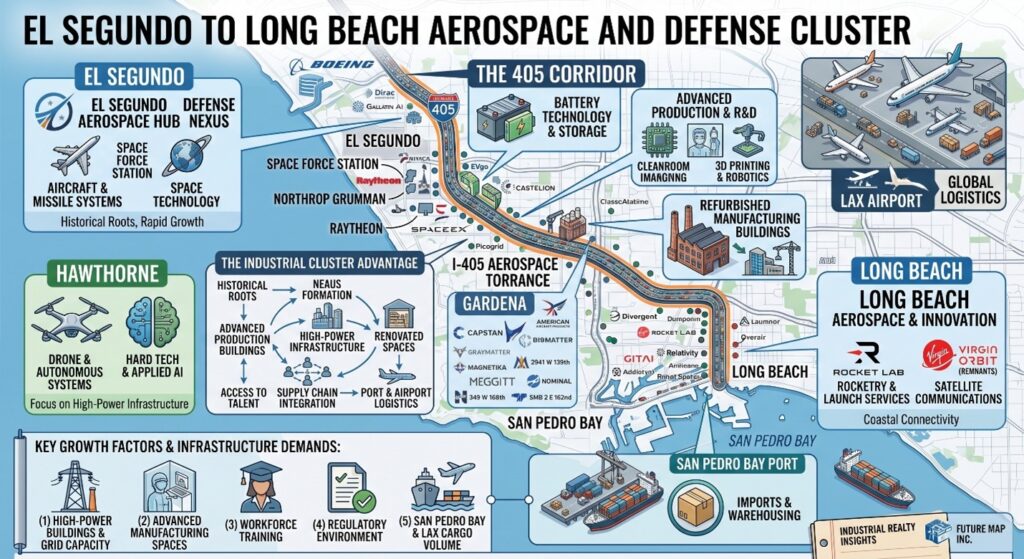
Gateway investors tend to be very conventional using standard underwriting principles and at least in Los Angeles, conservative proformas that are reflective of a commodity business. Supply and Demand, Marginal Pricing, Competition. Cluster investing is more opportunistic, has momentum because of immediate corporate capital infusions, and improves greatly with local knowledge of expanding companies. Where I am in Gardena, investing performance improves when you have multiple sources of demand, for instance gateway and clusters. Dallas, too, is a Gateway with a Data Center cluster. Savannah/Charleston, a port and significant manufacturing asset (aircraft and auto). New Jersey, a port and Pharma cluster. Purchasing in regions with Gateways and Clusters combined provides more ways to lease a building.

Mr. Warehouse

What are you doing with AI? That is the question I try to answer with my SIOR colleagues. Most have used AI for documentation preparation like offers, proposals, invoices, and lease negotiation. Some have created an underwriting platform for immediate valuations or use AI for research.  Not too many have gone all in with a complete recreation of their business, although that is where AI adoption is headed. AI creates an abundance of intelligence that no human can control except with more AI. Taking that next step of controlling AI and using agents, especially in connection with real estate deals, is where we get bogged down.

With the advice of a pioneer in our group, I put our AI persona under a more recognizably and searchable name and we choose Mr. Warehouse. Mr. Warehouse is an extension of our brokerage practice using the extensive data we generate and manage about gateways and clusters throughout the U.S. and beyond. It would be impossible if we did not have SIOR colleagues on the ground in every location and AI to make relationships. Our philosophy is to let AI lead, and we’ll be its human agent.

One area that we have researched and developed is location data.  Location data creates spatial relationships that are essential to producers, suppliers, distribution networks, and capital to create real estate value. Every property has longitude and latitude that AI can read make spatial relationships. We have found with the right spatial location and a personal relationship, it can be the the right environment to make a deal. Succinctly, Mr. Warehouse is using AI data and feeds, to make personal relationships, and create deals.

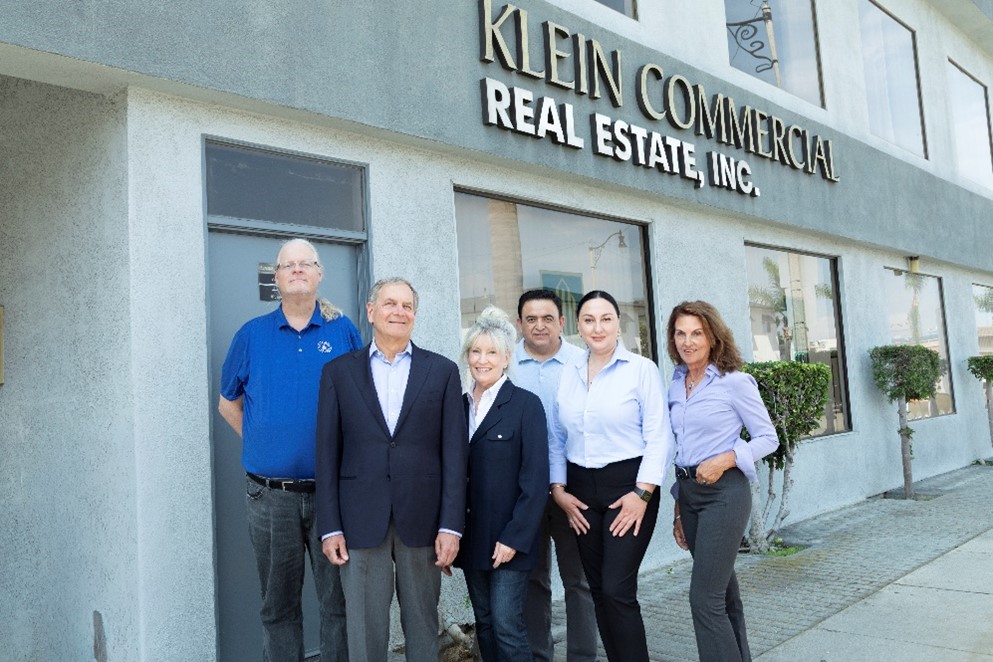
For immediate intelligence, on the ground knowledge is one area where humans still have an advantage. It is the reason our office is located on Gardena Boulevard to be close to our customers. We expanded our office to learn more about properties and clients in our core market, from LAX to the Harbor. We are fortunate to have the twin drivers of gateways and clusters in our market. Please refer to our Team Page and feel free to contact us any of us about industrial property.
From Vibe Coding to Deal Intelligence: How One LA Broker is Quietly Building a Tech Edge

From Vibe Coding to Deal Intelligence: How One LA Broker is Quietly Building a Tech Edge

From Vibe Coding to Deal Intelligence: How One LA Broker is Quietly Building a Tech Edge

The barrier between “having an idea” and “having a working tool” has essentially collapsed. Most commercial real estate brokers haven’t noticed yet. Jim Klein has.

Klein, an industrial real estate specialist in the Los Angeles market and a seasoned SIOR member, has spent the past stretch of time doing something most brokers his caliber rarely do: building his own technology stack. Not by hiring developers. Not by purchasing enterprise PropTech subscriptions. By sitting down with AI tools and describing, in plain English, exactly what he needs and watching functional software materialize in response.

It’s a practice gaining traction in tech circles under the name vibe coding, and it may be one of the most underappreciated skill sets a commercial broker can develop right now.

The Broker-Builder

There’s a new archetype emerging in commercial real estate. Not a technologist. Not a software entrepreneur. Just a seasoned practitioner who got curious, leaned in, and discovered that building useful tools no longer requires knowing how to code.

Vibe coding works exactly the way it sounds. You describe what you want to an AI. The AI writes the code. You refine it through conversation. You deploy it. The “coding language,” as Jim puts it, is basic English and that’s precisely what makes it accessible to anyone willing to try.

He offers one honest caveat worth passing along: having someone with a programming background nearby during those early sessions helps clear the initial hurdles. The fundamentals of how scripts connect to platforms and APIs aren’t always intuitive the first time. But once you’re past that threshold, the playing field levels quickly and the possibilities expand fast.

Two Platforms, Two Distinct Superpowers

What makes Jim’s approach particularly instructive isn’t just that he’s using AI. It’s how deliberately he’s matched the right tool to the right job. He’s built a two-platform intelligence system, each one purpose-designed for a different dimension of his business.

Gemini: The Market Radar

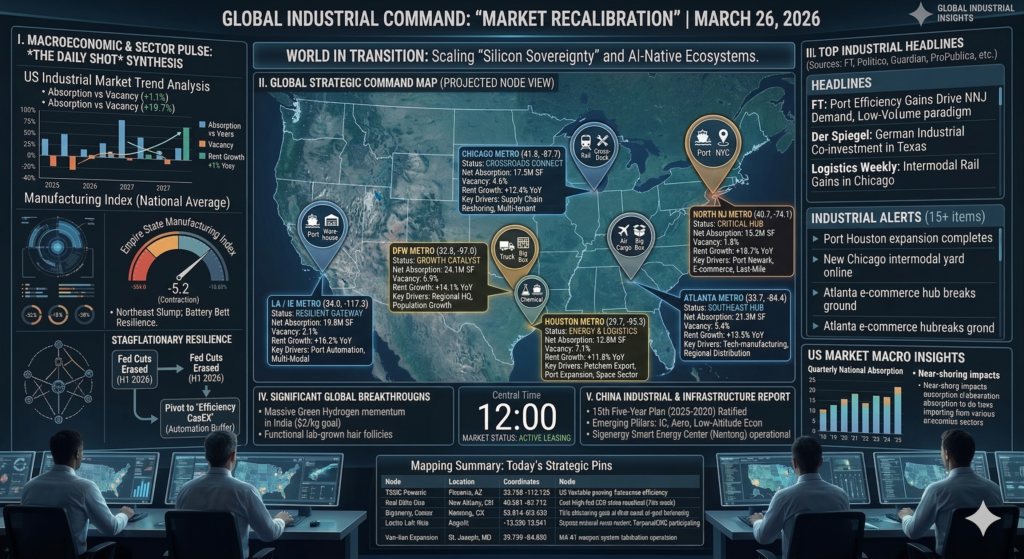
Jim has configured Google’s Gemini as a live intelligence feed for the industrial sector. Every day, it pulls news from sources around the globe, publications and Google Alerts he’s personally curated, and filters everything through a custom keyword ranking system. Words like expansion, growth, layoffs, WARN notice, and default trigger prioritization, automatically surfacing the stories most likely to signal a leasing event, a distress opportunity, or a tenant in motion before the broader market catches on.

What elevates this beyond a standard news aggregator is the Google Maps API integration. Every story arrives with precise location data attached. A logistics company announcing expansion in the Inland Empire isn’t just a headline. It’s a pin on a map, a radius search waiting to happen, a prospecting call that can be made before a competitor has even seen the news.

The infrastructure behind all of this? Google Workspace. Gmail. Sheets. Calendar. Docs. Tools every broker already has open on their desktop every day. What Jim discovered, and what most brokers haven’t yet, is that every one of these tools has script extensions that can be unlocked through AI-generated code. You describe what you want. The AI writes the script. When something breaks, it debugs itself.

The entire workflow is built on tools you already pay for. The only new ingredient is knowing to ask.

Claude: The Market Intelligence Engine

The second platform in Jim’s stack is Anthropic’s Claude, and here the application shifts from market surveillance to deep market knowledge.

Jim has loaded Claude with Los Angeles parcel data and market comparables, effectively transforming it into a conversational database that would have required a dedicated GIS analyst to replicate just a few years ago. From anywhere, including the field, he can ask:

  • “Who are the closest building owners within 1,000 feet of this address?”
  • “How does our listing compare to everything available within a one-mile radius?”
  • “Who owns 123 Main Street?”

Answers come back in seconds, often with maps generated on the fly. And this is just the beginning. CRM data integration is next on Jim’s roadmap, meaning contact history, deal activity, and relationship context will soon layer directly on top of the parcel and market intelligence already in place.

This is what a true deal intelligence platform looks like when it’s built by someone who actually understands their market, not by a software company making educated guesses about what brokers need.

The Question Every Broker Should Be Asking

Jim frames the real challenge with characteristic directness:

“How are you making more deals with AI?”

Not “Are you using AI?” By now, almost everyone can check that box in some form. The sharper question is whether AI is actually changing your deal count, your deal quality, or your competitive position. That requires a different level of intentionality than having a ChatGPT account you open occasionally.

Jim’s framework offers a useful benchmark. His AI stack is:

  • Proactive, not reactive. It surfaces opportunities before he goes looking for them.
  • Location-aware. Every piece of intelligence is anchored to geography.
  • Integrated. Tools communicate across platforms he already uses daily.
  • Field-ready. It works when he’s standing in front of a building, not just when he’s back at his desk.

That’s not a technology experiment. That’s a competitive infrastructure.

The Window Is Open, But Not Forever

The early adoption advantage in AI-powered brokerage workflows is available right now. But windows like this don’t stay open indefinitely. The brokers who will look back on this moment as a turning point are the ones treating AI not as a novelty, but as infrastructure to build on. Quietly. Deliberately. Deal by deal.

Jim Klein’s example makes one thing clear: you don’t have to wait for a PropTech company to package this into a product. You don’t need to hire a developer. You need curiosity, a willingness to experiment, and maybe one person nearby who’s been around code before.

The rest, it turns out, you can figure out in plain English.

Jim Klein, SIOR, is a commercial real estate broker specializing in the industrial market in Los Angeles. His work in AI-integrated market intelligence reflects a growing movement among top practitioners applying practical technology to generate measurable business results.


Four Types of Industrial Real Estate Decisions

Four Types of Industrial Real Estate Decisions

Four Types of Industrial Real Estate Decisions


For decades, the U.S. industrial real estate landscape was largely shaped by the flow of consumer goods. e-commerce, brick-and-mortar supply chains, and manufacturer distribution networks. This model is not going away and will be enhanced by more e-commerce. However, a profound shift is now underway. New trade dynamics, tax incentives; and support for AI and Data Centers will re-orient location and capital decisions.  There is a new emphasis on factors crucial for enhanced industrial production. This evolution leads to richer set of criteria for assessing location value with an emphasis on network dynamics, supply chain and underlying AI infrastructure.

For companies that are facing real estate decisions, we found the following framework helps you determine the type of move you are most likely to take.  The first three type of decisions are accepted as standard procedures in corporate real estate circles. Infrastructure demands, particularly power, connectivity, and location have grown to being singly important.

  1. Incrementalism
  2. Standardization
  3. Value-based
  4. Infrastructure Dependent


1. Incremental Growth: Remaining close to core operations and seeking nearby buildings to facilitates organic expansion or infill needs. This strategy prioritizes maintaining local expertise and established networks. Incremental growth is the most common way to expand. Value is based on proximity.

2. Standardization: Particularly relevant for companies taking multiple facilities to support regional markets or industries. This approach emphasizes consistent specifications and operational efficiency across a distributed network.Common examples are consumer products, industrial supply, and data centers.


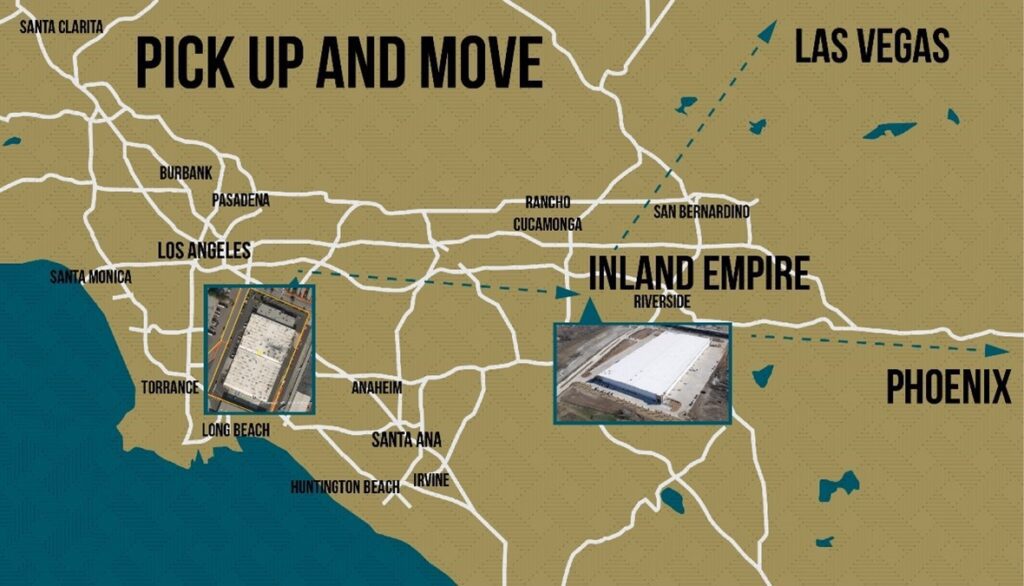
3. Value-Based: Driven by new strategic directions or significant restructuring, this often involves a “Pick Up and Move” to a fundamentally different area, chosen for its long-term alignment with core values and future growth. This frequently occurs when companies leave California for lower costs, fewer regulations or improved synergies with suppliers and customers


4. Infrastructure Dependent: The largest expenditure of industrial development is data centers. Hyperscalers are dependent on huge amounts of power and connectivity on relatively large parcels of heavy industrial land, almost anywhere. Edge data centers are smaller and located in urban centers to serve autonomous vehicles, consumer, shopping, delivery and nearby industrial and commercial facilities.

 To support our clients, we developed these strategies over 45 years. We have custom analytics, self-developed maps and personal relationships across North America and Europe.  Our diagnostics pinpoint the buildings that are right for you. Please contact us with your questions and comments.

Thank you for Subscribing.


Where to Find Hard Tech Buildings in Los Angeles

Where to Find Hard Tech Buildings in Los Angeles


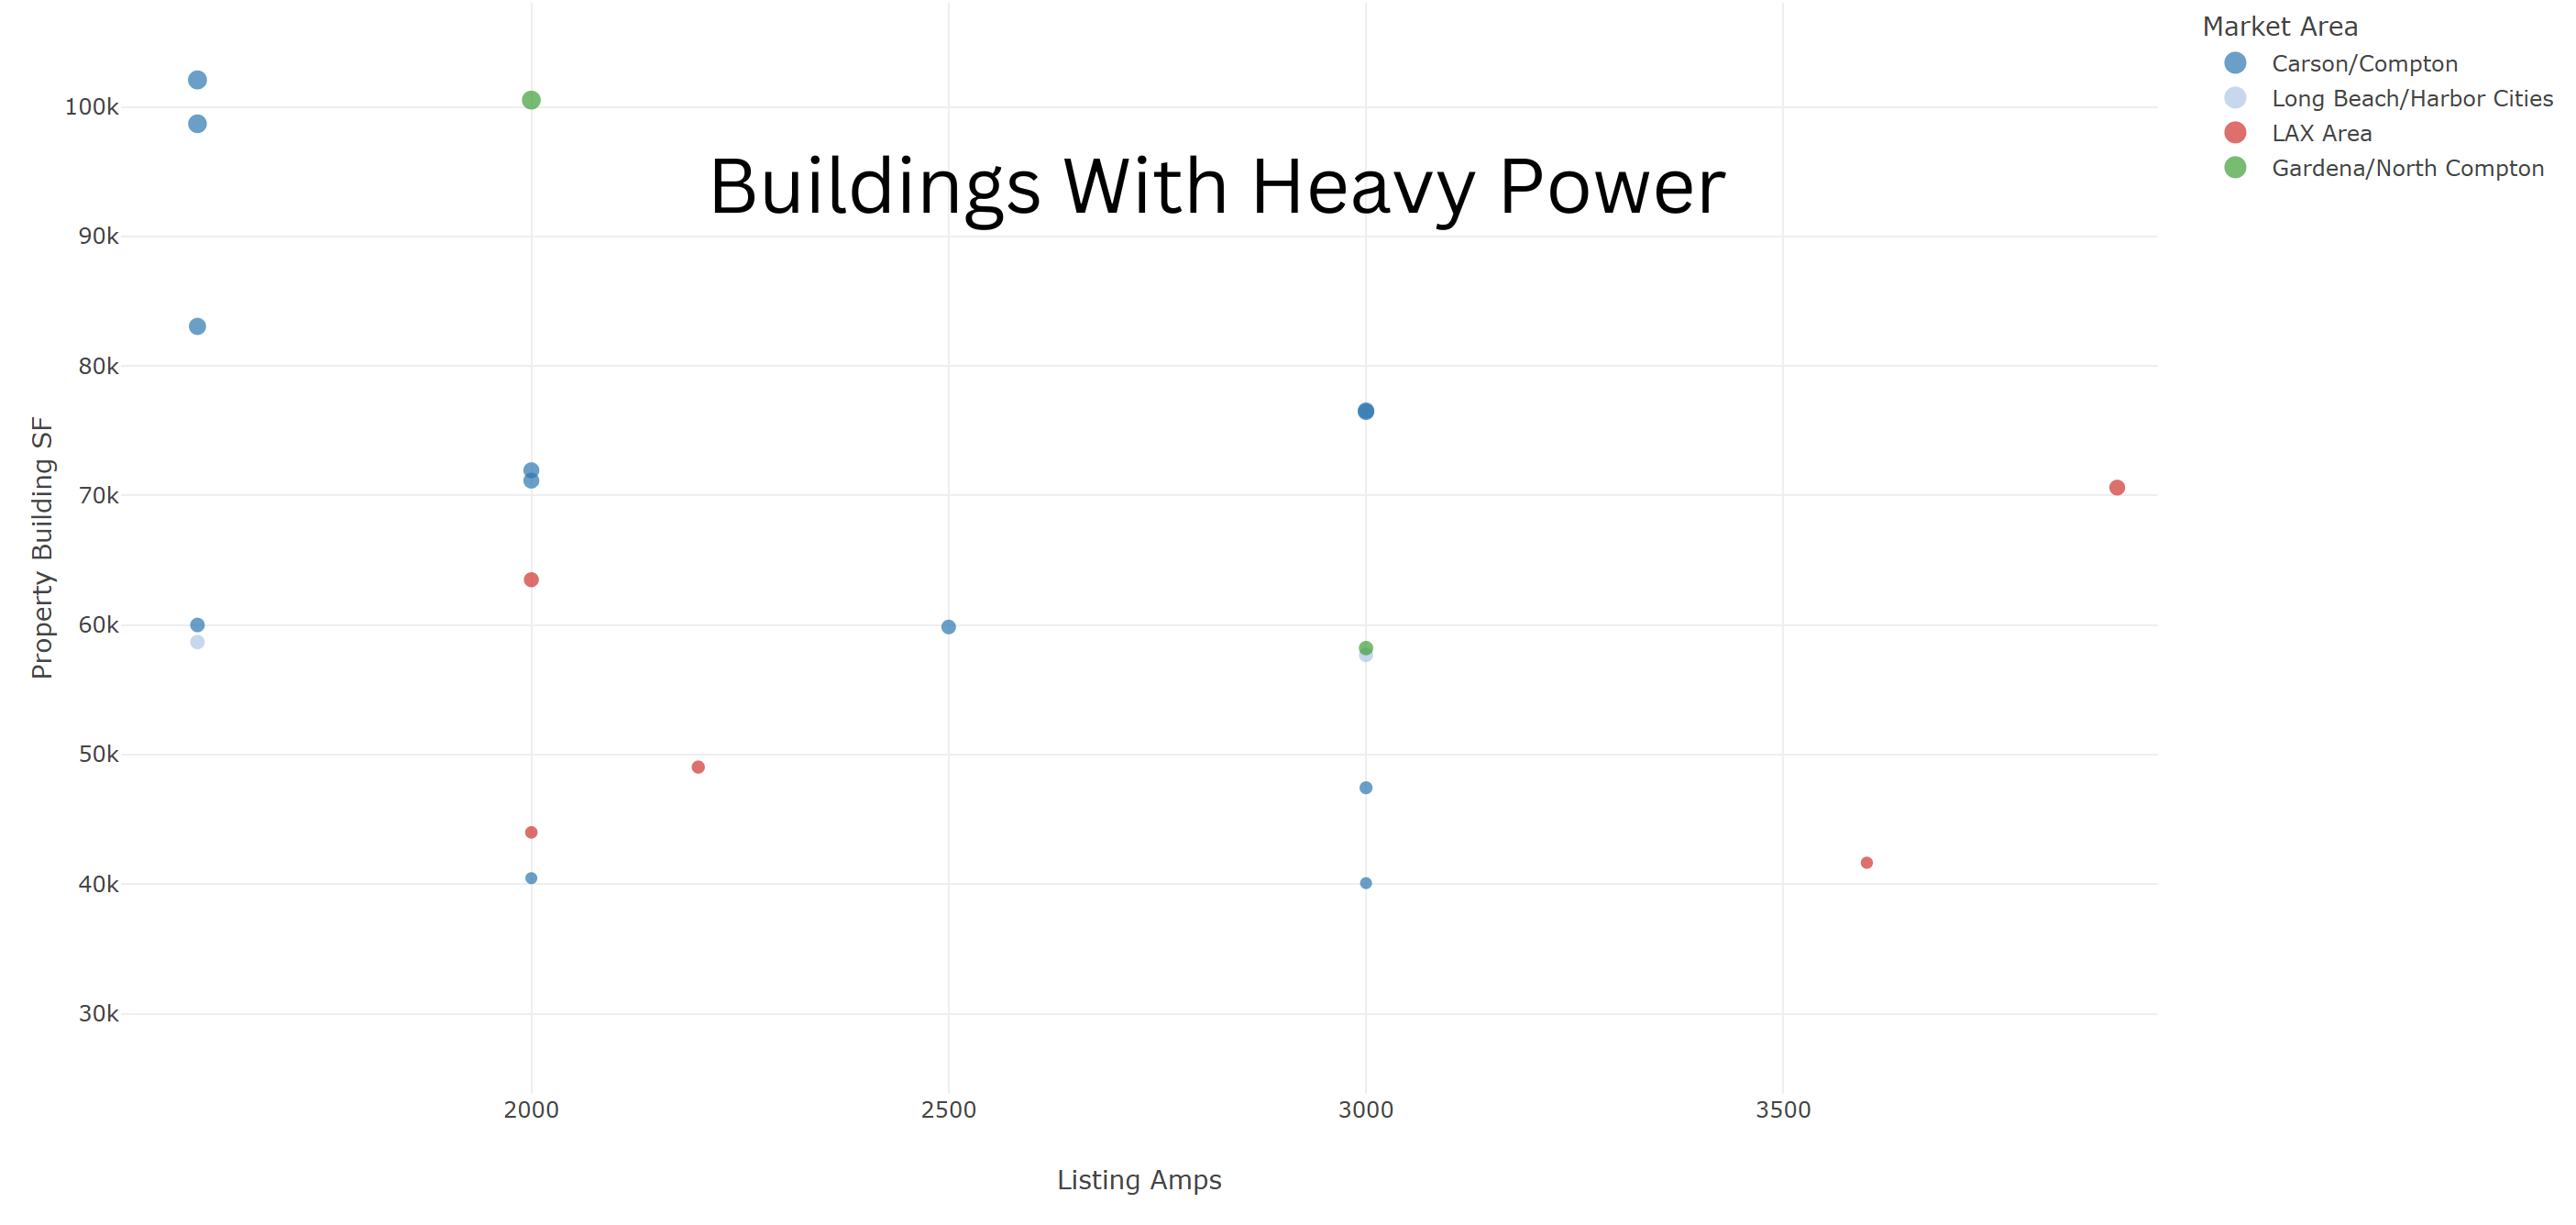
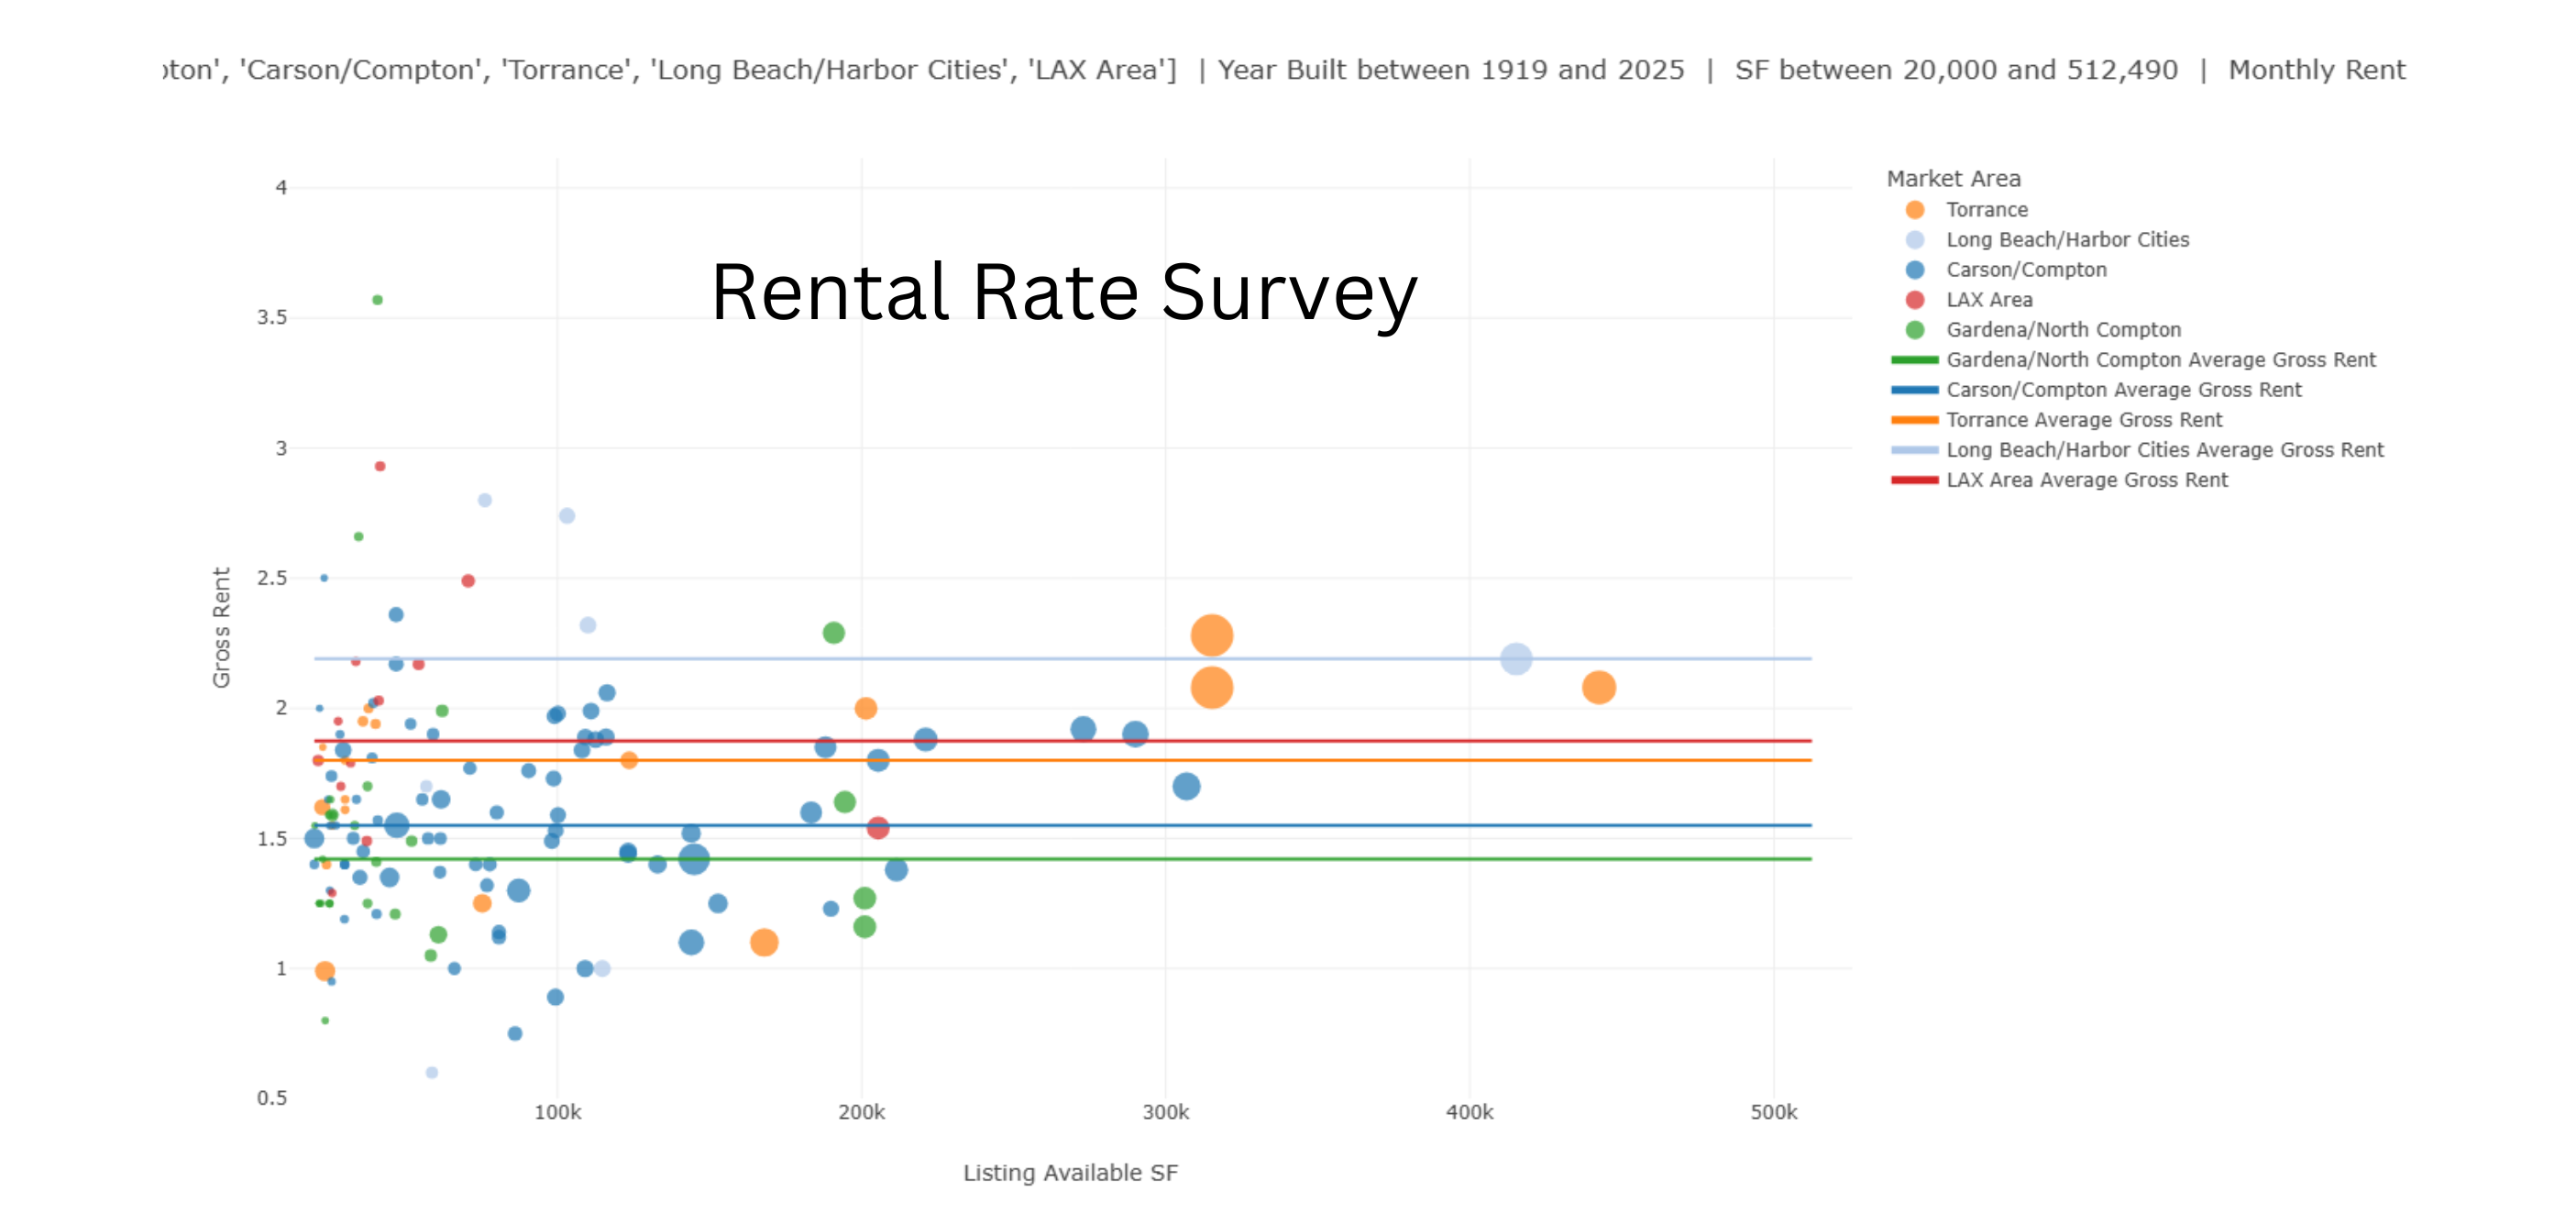
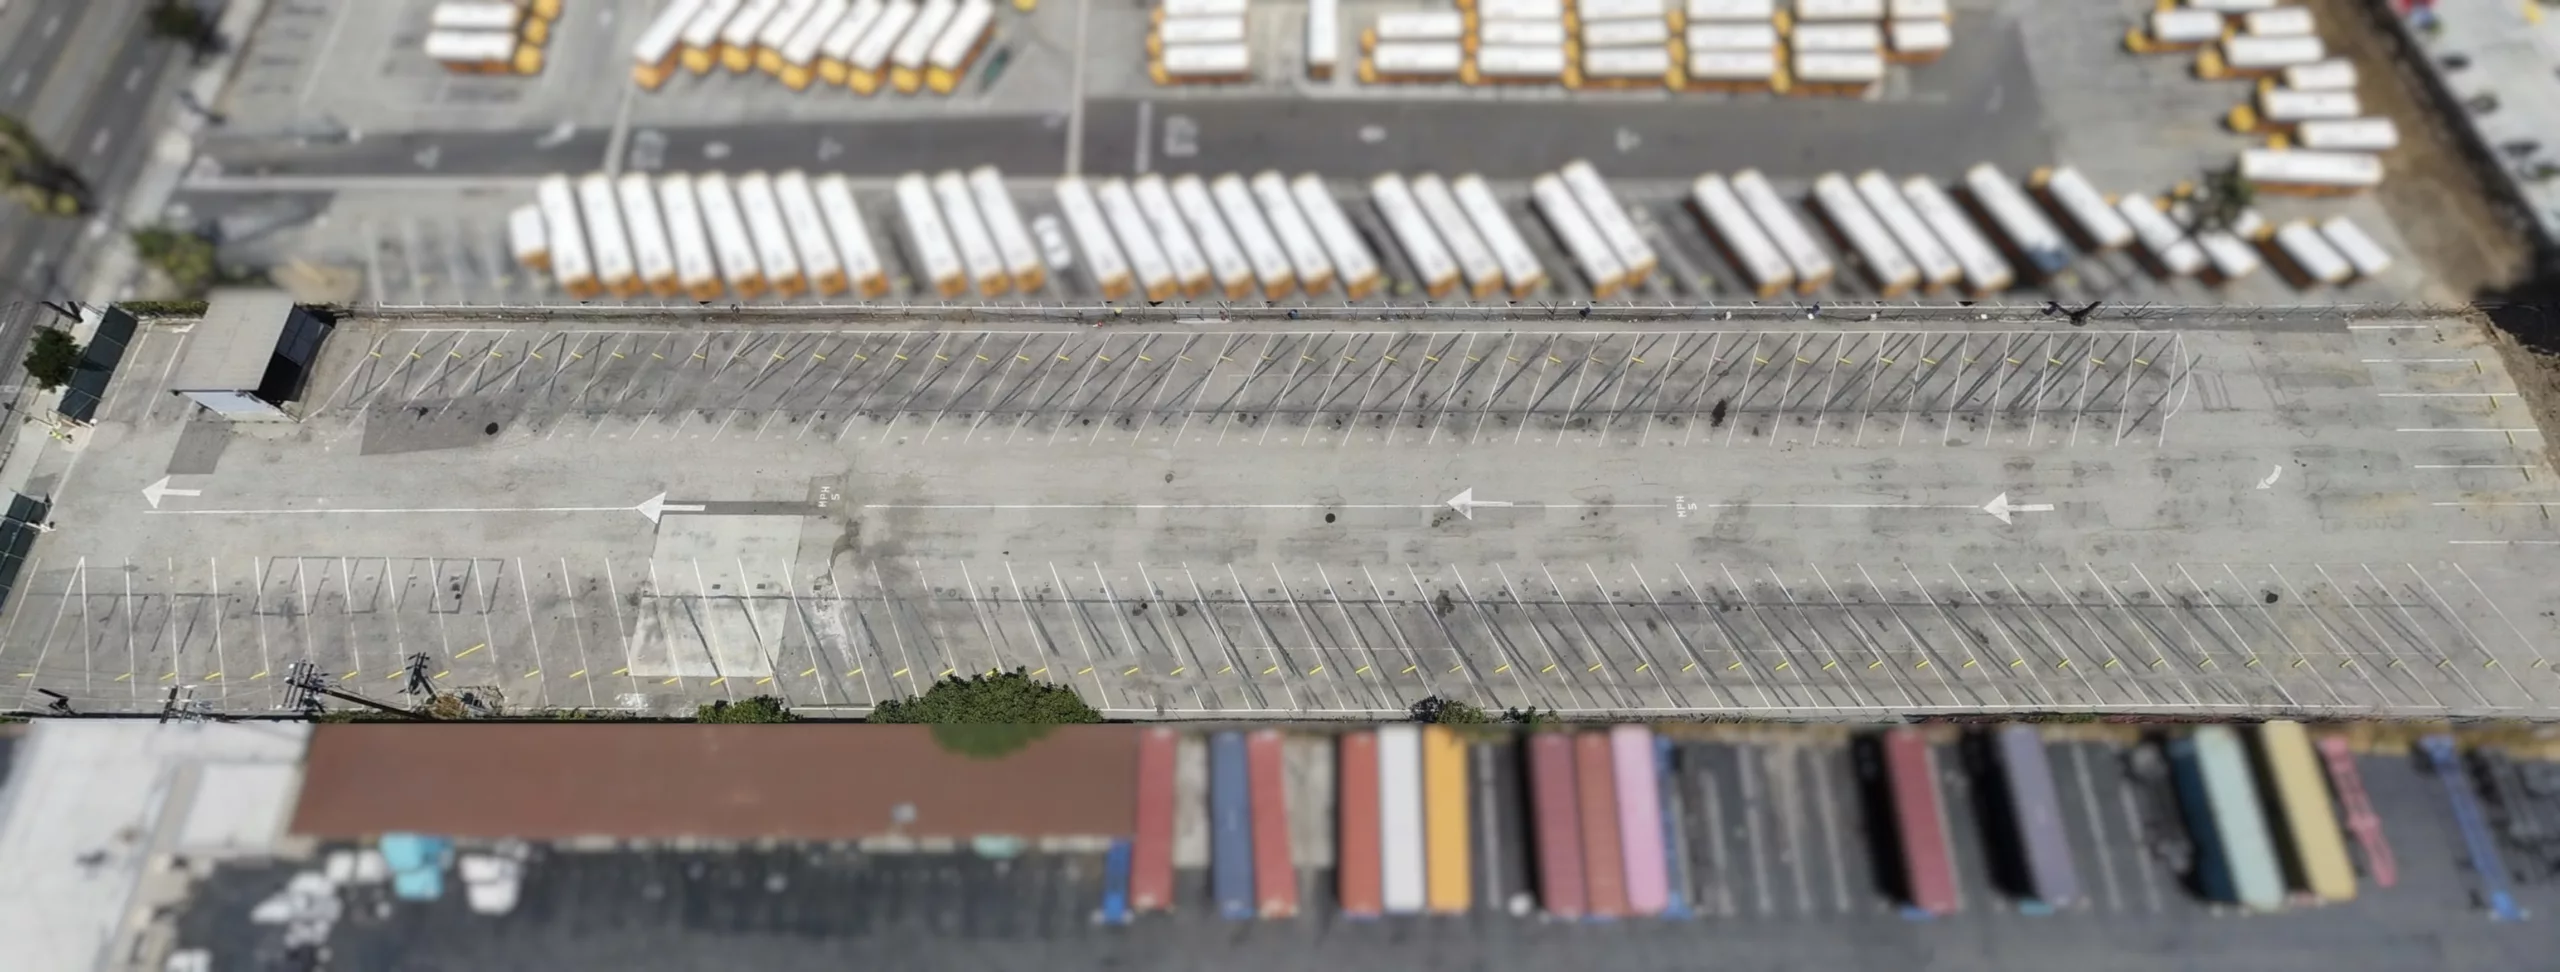
Despite higher than normal industrial vacancies, Hard Tech companies are finding it difficult to locate adequate industrial space. Many Hard Tech companies require substantial electical power. They want a free-standing building for U.S. Government clearance, more office space than is typical, a large parking area, and a location to attract engineers. Many Hard Tech companies prefer El Segundo and neighboring beach communities because of its history of aerospace and defense manufacturing. But they will consider other locatons along the 405 corridor from LAX to Irvine, including Torrance, Long Beach and other locations in Orange County. Some Hard Tech Companies will make the difficult decision to split their manufacturing from engineering to find the right facility in the location they want. Other parts of Los Angeles that served as machining centers in the past are located in Gardena/Carson, Commerce/Vernon and parts of the San Fernando Valley. Following are a couple of graphs describing market conditions:

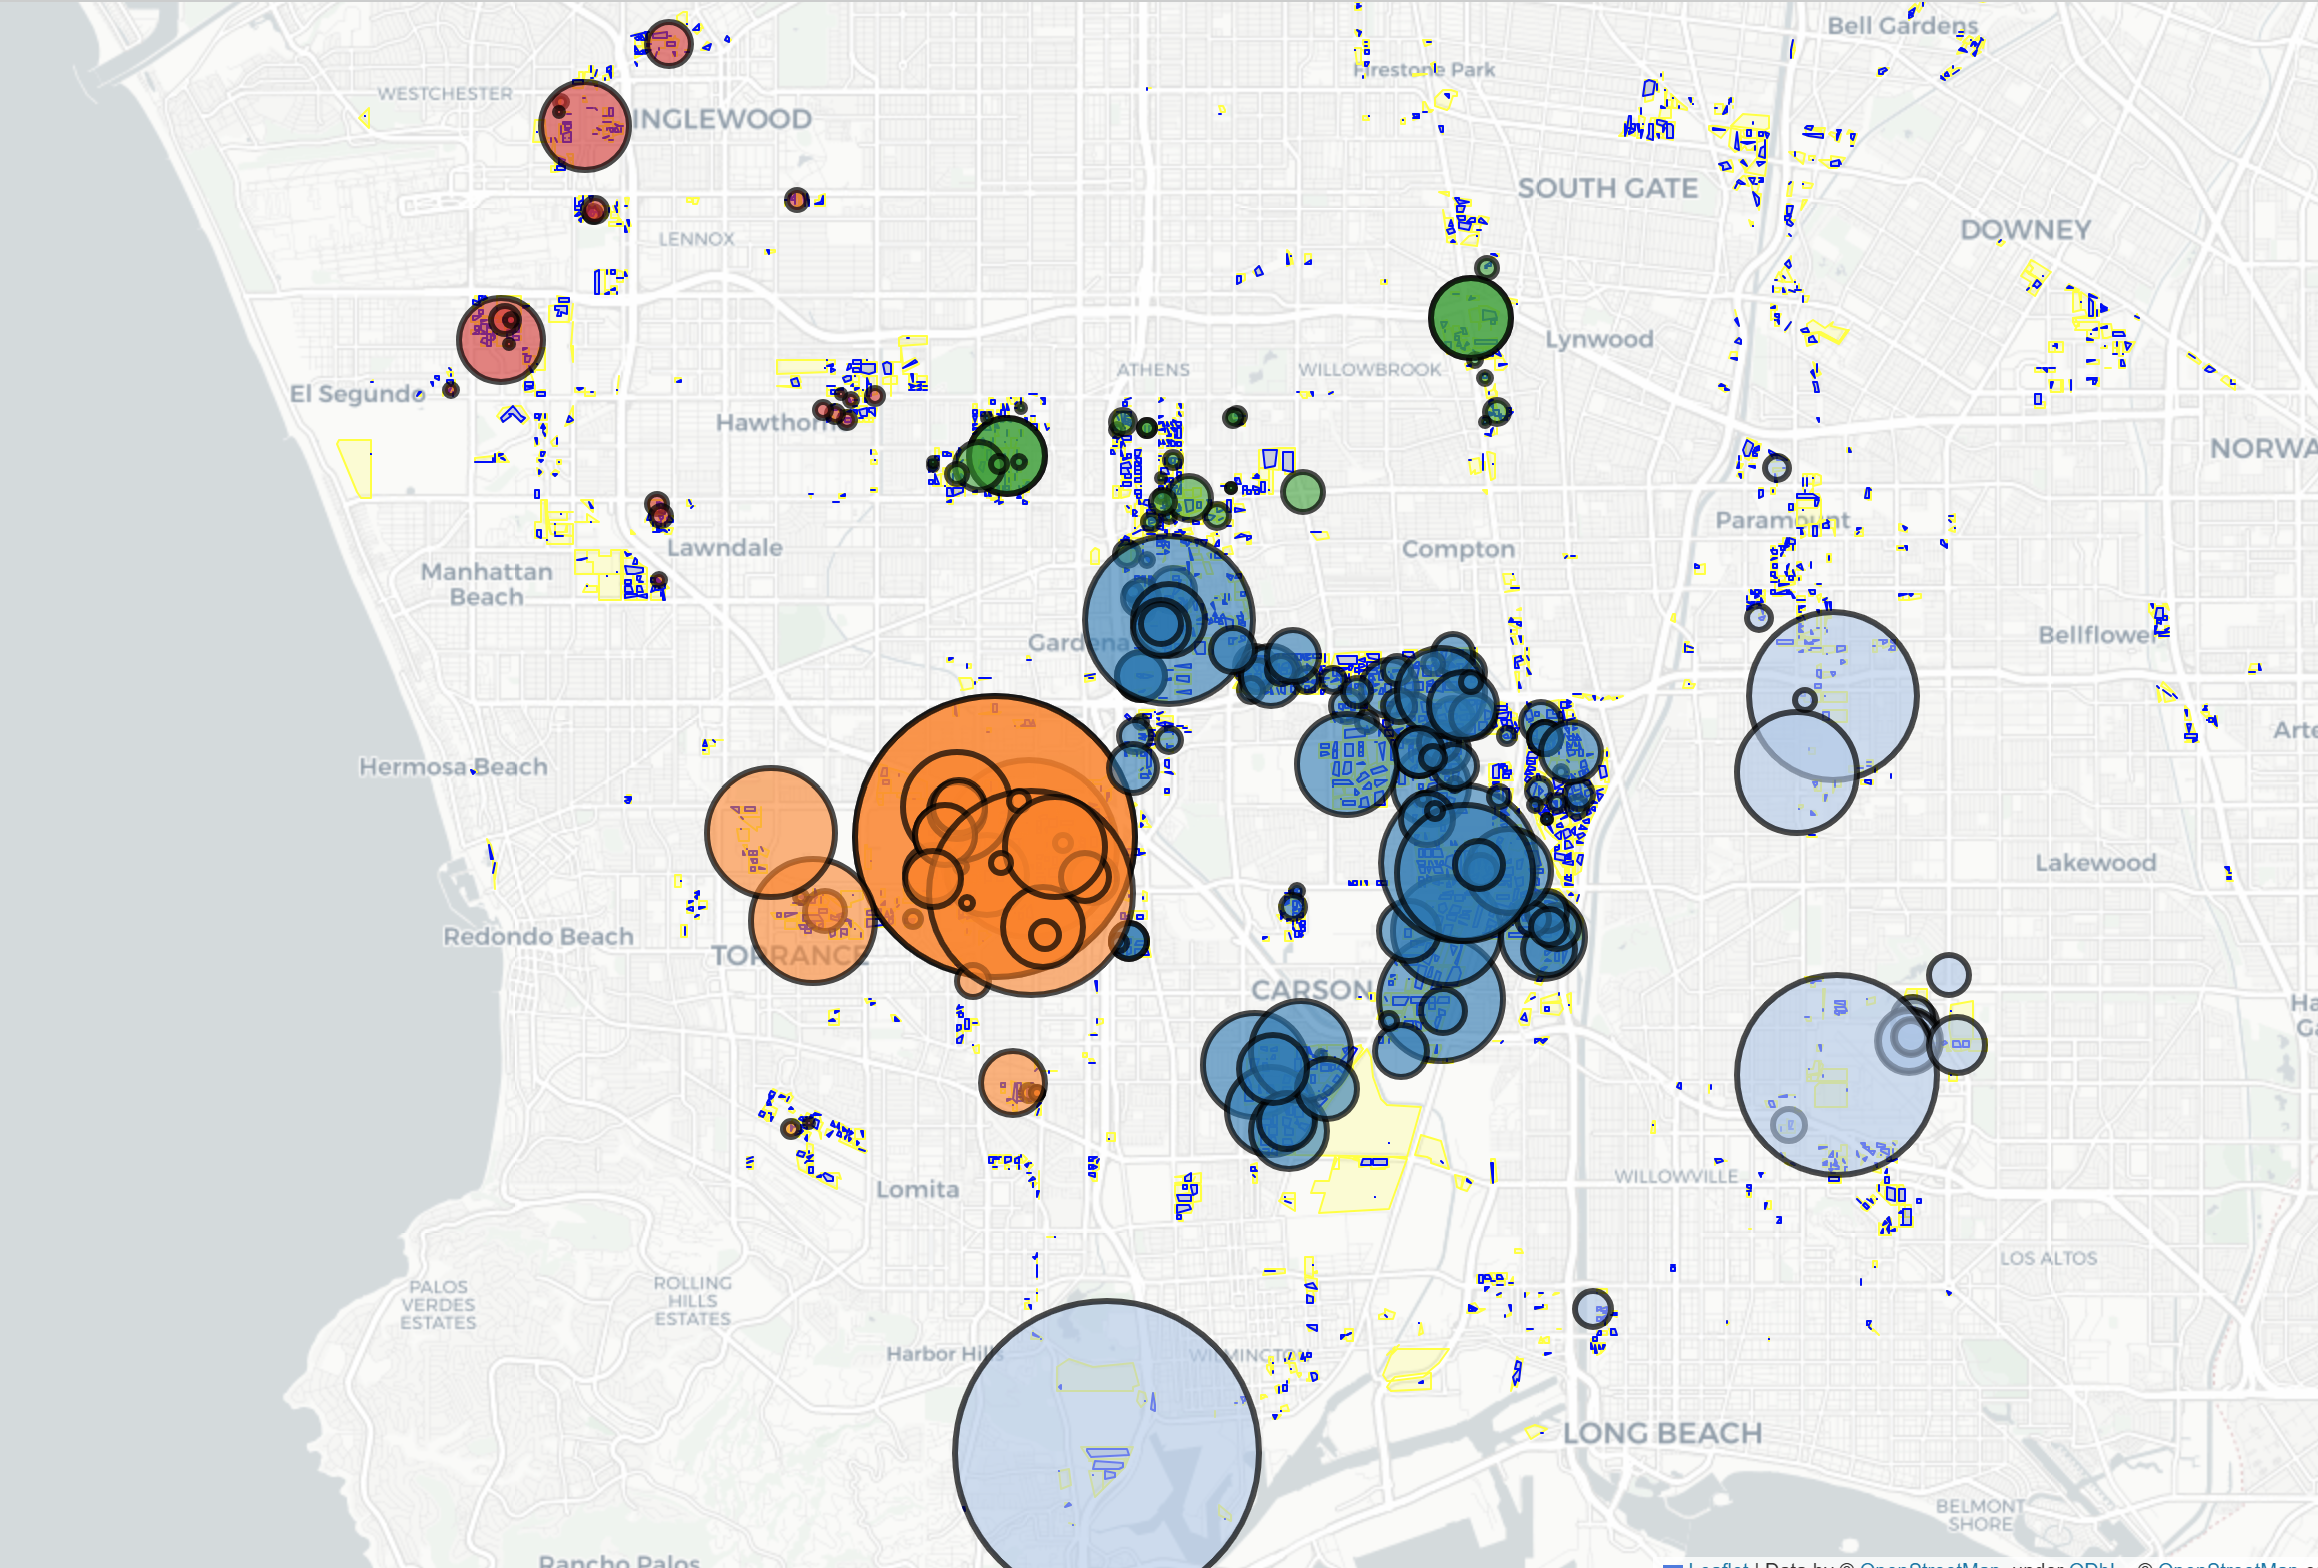
Offerings are scarce in the El Segundo/Beach Cities area.  When Hard Tech companies grow, they often look to Torrance, Hawthorne, Gardena, Carson or Long Beach. These cities are close to experienced engineers and they house good production facilities.


Power is a main criteria for many Hard Tech Companies.  If you need heavy power, 2000 AMPs or greater, there are only a few buildings with the necessary capacity in each square foot range.


Rents hover between $1.50 to $2.25 Gross per square foot per month depending on location and amenities.

If you are seeking a new building or have questions about Los Angeles industrial real estate, please contact us today.

Thank you,

Jim Klein, SIOR – Jimklein@kleincom.com

Quan Wu – Quan@kleincom.com


Industrial Building Sales

Industrial Building Sales

The Los Angeles industrial real estate market is financialized. That means pricing reflects accepted investment principles. Investment buyers, flush with private capital, are searching for smaller and older buildings than what you would normally expect from fund level buyers. Assets owned by individuals, corporations, families, and partnerships are being sold to large investment groups, funds, and REITS. It started with “Class A” buildings but escalated for almost all industrial buildings with low interest rates after the Great Financial Crisis. Activity surged during Covid, levelled off during the recent period of higher interest rates, and is regaining strength with more capital allocations hitting almost all industrial properties that generate long-lasting income.

In our experience, some building owners prefer comprehensive marketing and others want discretion. We developed our resources to do both:

Conventional Listing Private Listing
Exclusive Non-Exclusive
Market Rate Broker Fee Lower Broker Fee
Generally, No Dual Agency Dual-Agency
Common with Owner/Users Common with Investor/Developer Sales
No Immediate Hurry Deadline
Public – Wider Distribution Confidential and Discrete
Dedicated effort and resources Flexibility – Can sell yourself
Posted online and through Industrial Multiple Distributed to professional buyers

How to Find the Best Industrial Building Today

How to Find the Best Industrial Building Today

How to Find the Best Industrial Building Today

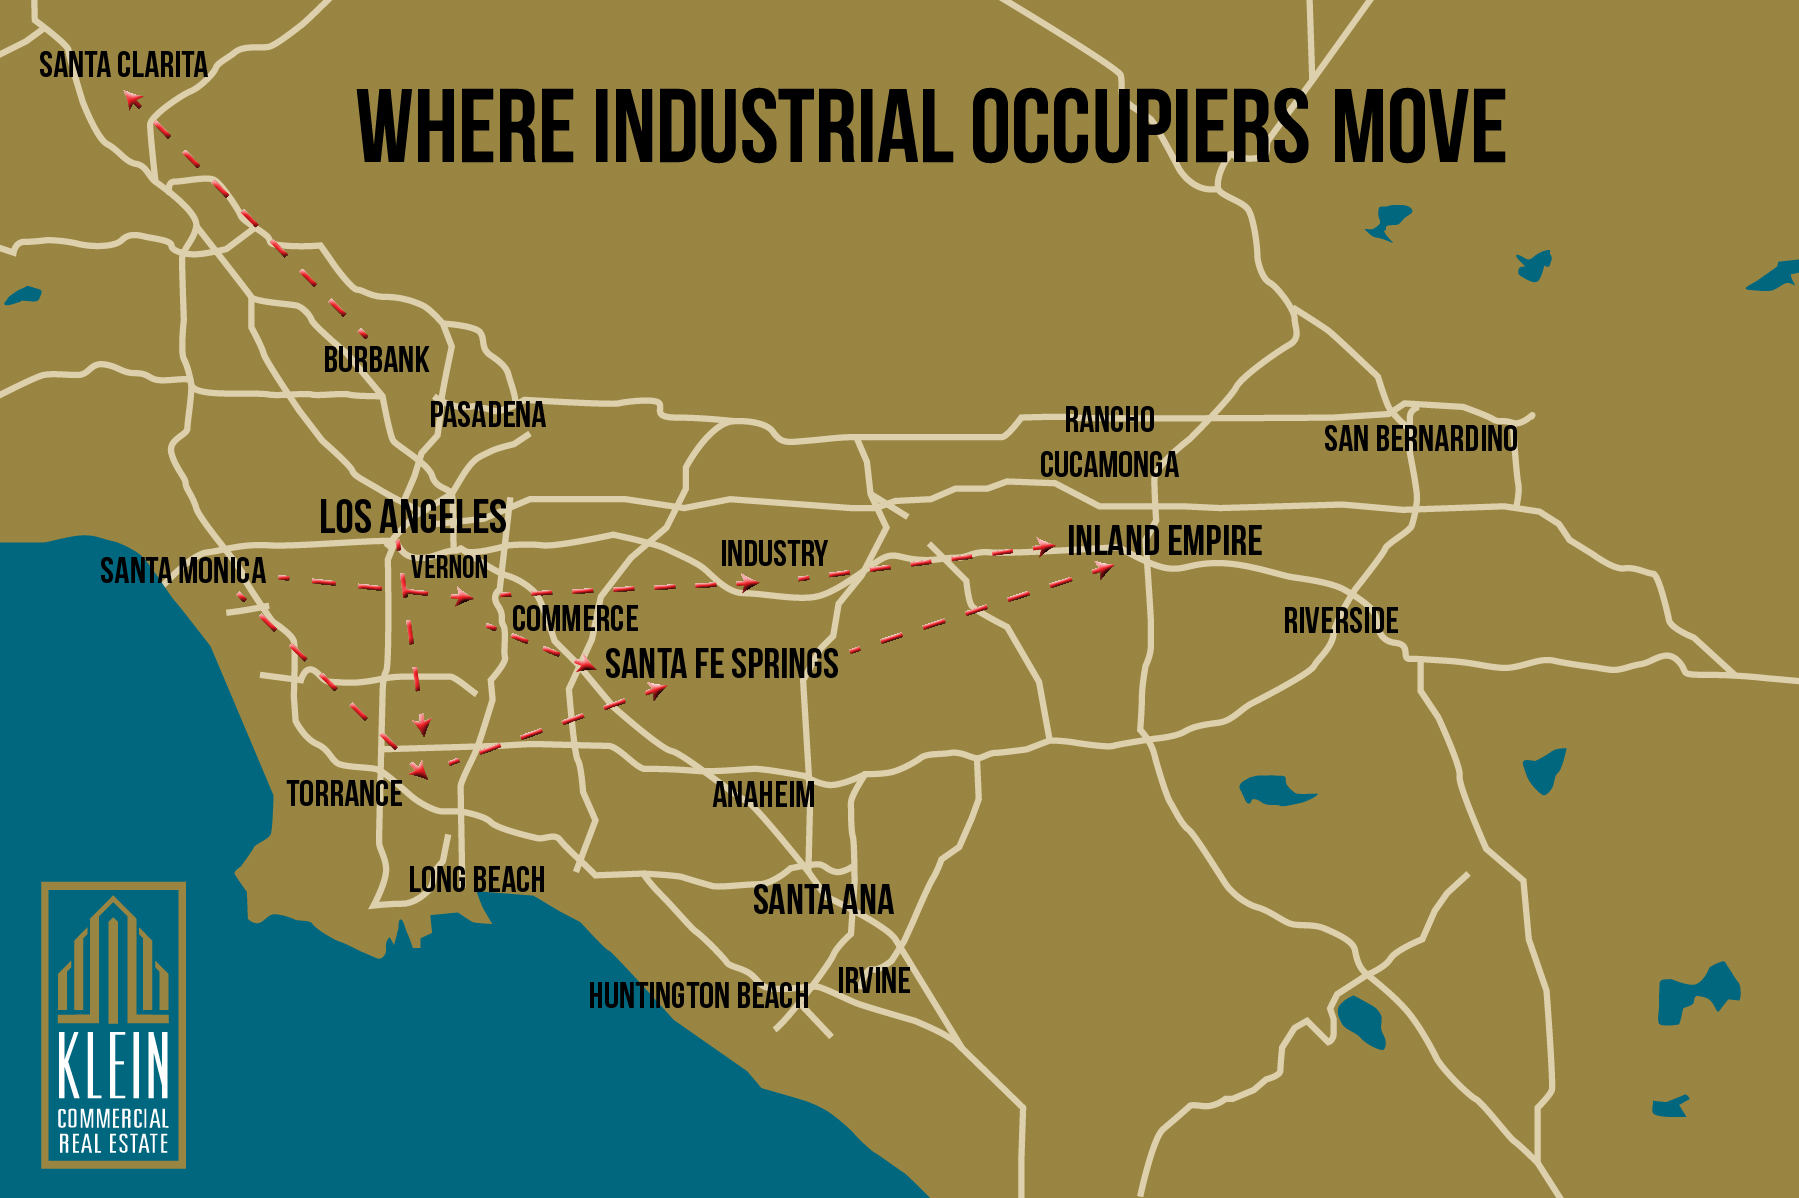
Map of Where Industrial Occupiers Move
Where Industrial Occupiers Move

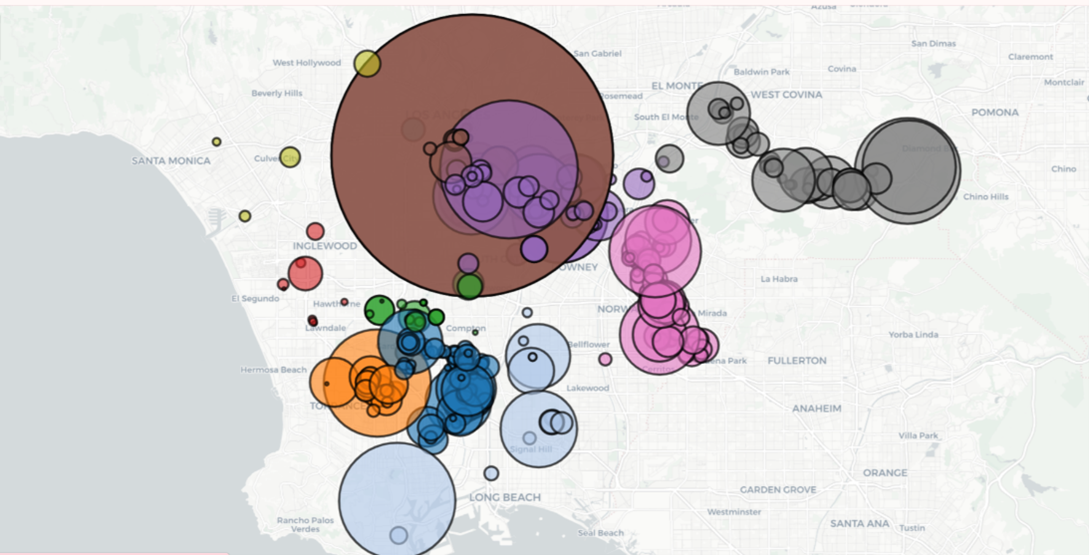
In less than 18 months, the industrial building market has shifted from low vacancy to abundancy. There are now 215 industrial spaces, greater than 50,000 square feet, available in the Greater Los Angeles Basin. This does not include Orange County, Inland Empire, or San Fernando Valley. Only the areas you see on the map (below). About 20% is sublease space.

The best value for most tenants is second and third generation spaces. Many of these buildings built since the year 2000 have the same characteristics as brand-new buildings except for ceiling heights, although many of these 2nd Gen buildings still go to 30’.

  • 36’ high buildings came in around 2023
  • 30’ – 32’ Clear was the norm starting in 2000
  • 24’ Clear started as far back as 1975

Older buildings are equally functional as new buildings for less rent, especially if they have a low tax basis. One exception is if the tenant plans to install interior warehouse installations like mezzanines or specialty racking and automation. In these cases, latest generation buildings have an economic advantage because of height.

Some of the calculations we perform to determine functionality include:

  • Location and Distance
  • Docks per 10,000 SF
  • Building to land ratio
  • Cubic Capacity and Cost per Cube
  • Property Taxes/Expenses
  • Ceiling height
  • Sublease

To identify the better buildings, we subject all available properties through a macro analysis. This is the best way to identify differences in functionality and cost when there are a lot of choices.

Here is an example:

Let’s say you are in 100,000 square feet in the South Bay and you want to double in size. Some tenants will move completely to put everything under one roof. Other tenants will look for a satellite building as an interim step. Most South Bay companies will look locally and as far as Santa Fe Springs and Mid Counties. Some will want to go as far as IE West. What will you find?

Streamlit Demo View
Streamlit Demo View

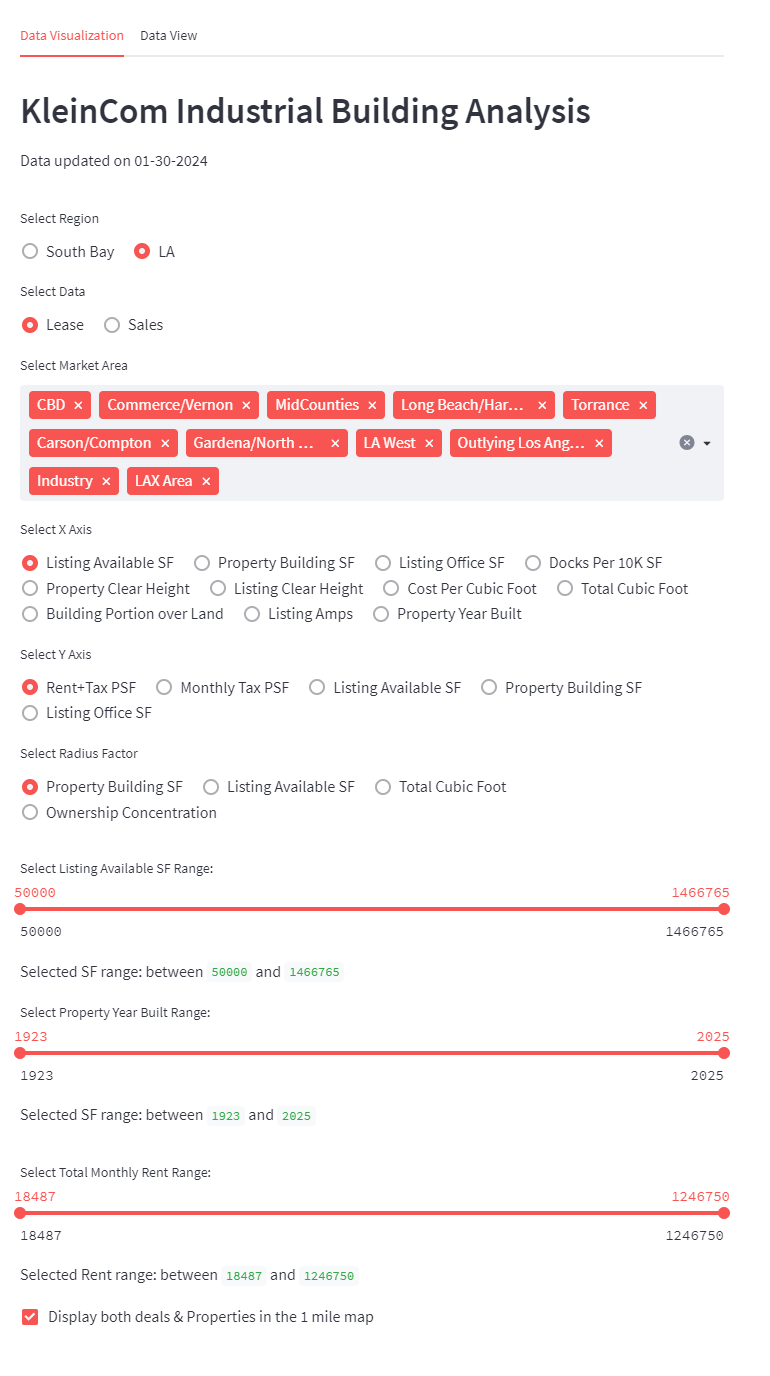
We model the entire market on the Kleincom Industrial Building Analysis we developed on Streamlit. For this report (100,000 SF to 250,000 SF), we identify 55 choices of which 14 are subleases with terms of at least 3 years (some up to 5). For demonstration purposes, we will leave aside, the additional 80 or so buildings in Inland Empire West (Rancho Cucomonga, Ontario, Chino, and Fontana) that meet the size requirement.

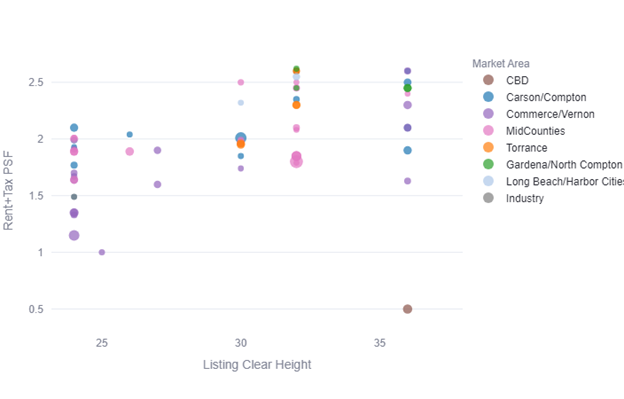
Using Ceiling Height with 24’ as the minimum, we establish the following distribution. For most tenants, 30’ to 32’ is the sweet spot.

All Buildings 100K to 250K

Buildings are dispersed over the entire Los Angeles Region.

Buildings 100k to 250K L.A. Basin

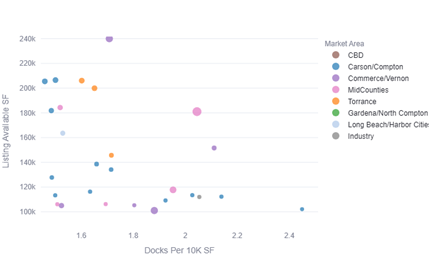
The second factor to sort the choices is the Loading Dock Ratio measuring docks per 10,000 square feet to determine loading efficiency. Any dock ratio greater than 1.5 doors/10,000 square feet is considered highly efficient and closer to 2 docks/10,000 SF is superior.

Docks Per 10k SF
Docks Per 10k SF

Looking at the top results, it’s not always the newest buildings that are the best choices. You can lease 2nd or 3rd generation buildings for $1.75 to $1.95 per foot (all-in). About half of the buildings are 30’ or greater.

Results Table
Market Area Size Rate Month Clr Year Cubic Ft Dock Ratio B:L
Gardena/ Compton 300000 1.6 $480,000 26 1987 7800000 3.33 40%
Carson/Compton 300000 1.53 $459,000 25 1970 7500000 1.84 52%
Carson/Compton 285000 2.2 $627,000 32 2006 9120000 2.24 41%
Carson/Compton 250000 1.51 $377,500 25 1972 6250000 2.17 60%
MidCounties 250000 1.8 $450,000 32 2002 8000000 2.05 59%
Carson/Compton 150000 2.1 $315,000 36 2024 5400000 2.84 60%
Commerce/Vernon 150000 2.6 $390,000 36 2024 5400000 2.11 55%

For some tenant’s subleases may be the right answer because the terms are relatively short, and the financial commitment will be less. Ecommerce tenants and larger Amazon/Temu Sellers are drawn to subleases. The top subleases have exceptional loading and low property taxes. In most cases, landlords will renew when the lease expires.

Best Subleases
City SF Yr Blt HGT DH Dock Ratio Years Remaining
Carson 300000 1973 22 40 1.33 3.69
Industry 225000 1996 30 25 1.11 5.58
Torrance 200000 2000 30 30 1.50 2.69
Torrance 135000 2001 30 25 1.85 3.44
Commerce 125000 1957 22 55 4.40 5.28
Santa Fe Springs 120000 2003 30 30 2.50 3.78
La Mirada 100000 1997 30 20 2.00 2.44
Compton 100000 1981 24 15 1.50 3.02

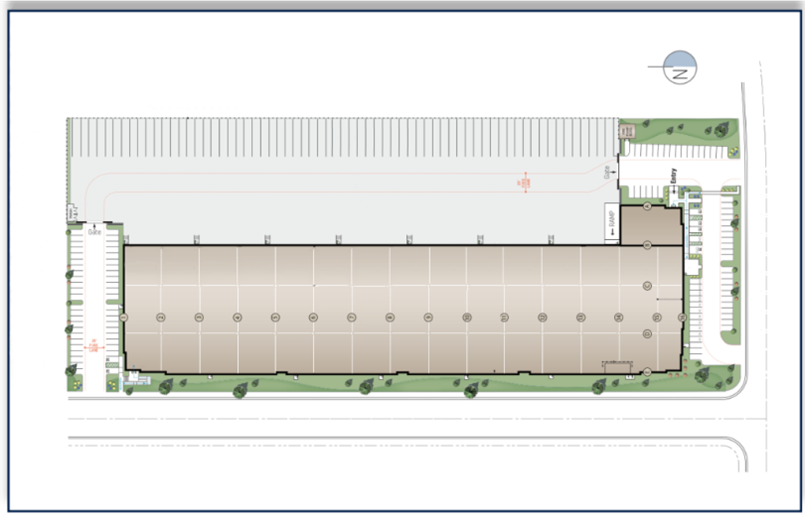
Experienced tenants will use site plans to decide. There is a preference for a more rectangular building than a square so you can load more trucks simultaneously and divided to sub-customers if necessary. Here’s an example of two buildings of approximately the same size and asking rent. Most tenants would prefer the first building because loading exceeds 2 docks per 10,000 square feet, it has additional trailer parking, and the warehouse can be easily divided into sections while maintaining optimum functionality.

The second site plan is reasonably functional but only has 1 dock per 10,000 square feet, can only be divided in half and is less functional than the first example. For the same cost, most tenants will choose the first building.

With the high cost of land and construction costs, developers need to maximize building coverage to compete and make a profit. In other words, developers are often forced to build the largest possible building on the site while doing their best to keep the building functional. As you can see, some buildings are more functional than others.

Every tenant has different priorities, but most revolve around the same criteria of location and function. At Klein Commercial, we have 40 years of corporate real estate experience locating the best buildings for our clients. Our latest tool, the Kleincom Industrial Building Analysis, will help you make the best choice amongst all the available space on the market today.

How Is Industrial Real Estate Today?

How Is Industrial Real Estate Today?

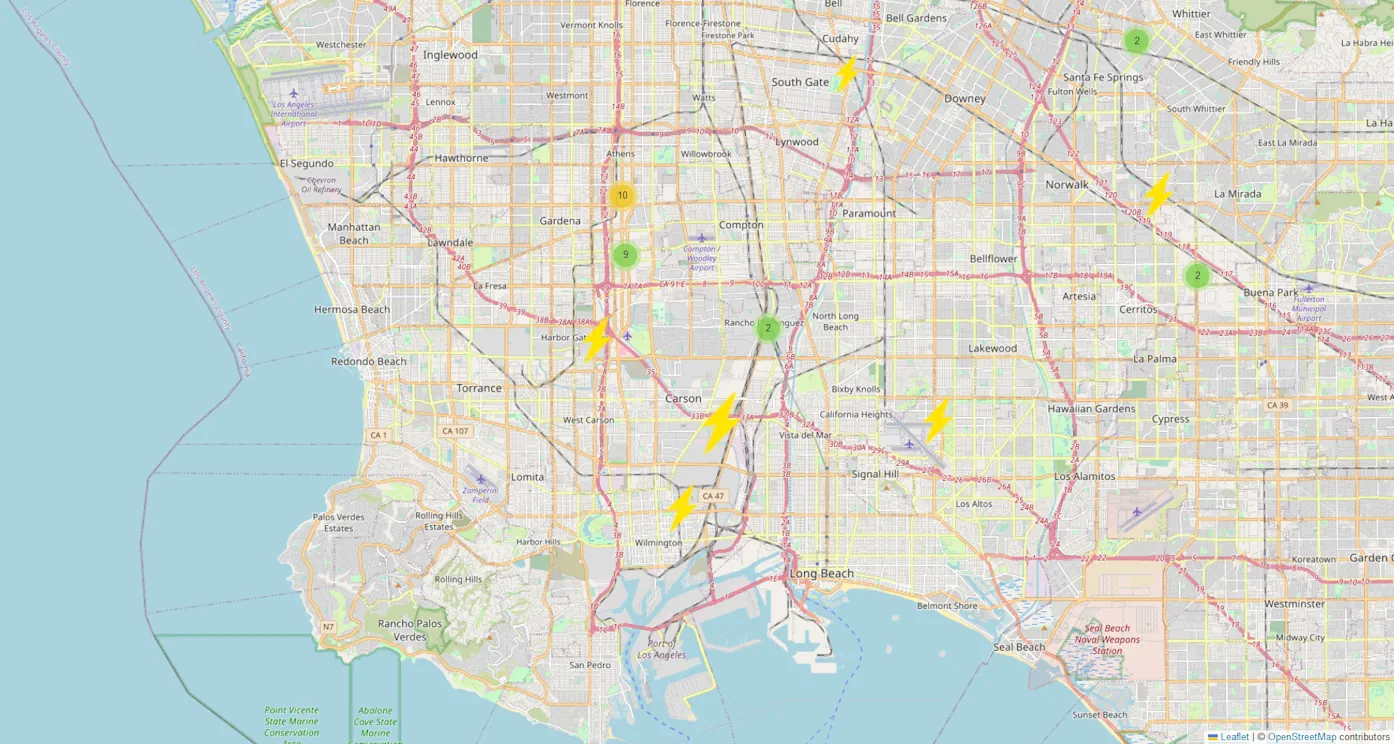
Map showing electrical symbol for buildings with increasing size based on building
Power Map of Buildings In LA County

Industrial real estate is a diverse business that includes Investment funds, developers, private/family owners, corporations, occupiers, and a mix of product types and industries. Industrial buildings are in every community and are the source of employment, production, distribution, and wealth for many. The nation’s economic health rides on the success of industrial real estate.

There are several factors that are driving deals today. Broadly, these include Interest Rate Policy, US Industrial Strategy, and Local Municipal Governance. Everyone is affected differently. For example, higher interest rates are never good for real estate, though they affect sales more than leases; sale transactions are interest rate sensitive while leasing is supply and demand based. As an experienced broker, we use detailed knowledge, market analytics, and long-standing relationships to help you in making the best decision.
Continue reading “How Is Industrial Real Estate Today?”

Three Innovations for 2023

Three Innovations for 2023

ChatGPT:

I could not start the year without acknowledging the tools that are currently available at Open AI. I’ve recently created a new FAQ page with the use of ChatGPT and Dall-E 2. It must have been under the wire before Google Search created new defenses against text bots. I received one solid lead from a company looking for 30,000 square feet because of the AI-generated explanation of my services.
Continue reading “Three Innovations for 2023”

Leasing Industrial Property in Los Angeles County Under the New Green Zone Ordinance

Leasing Industrial Property in Los Angeles County Under the New Green Zone Ordinance

Leasing Industrial Property in Los Angeles County Under the New Green Zone Ordinance

Green Zones

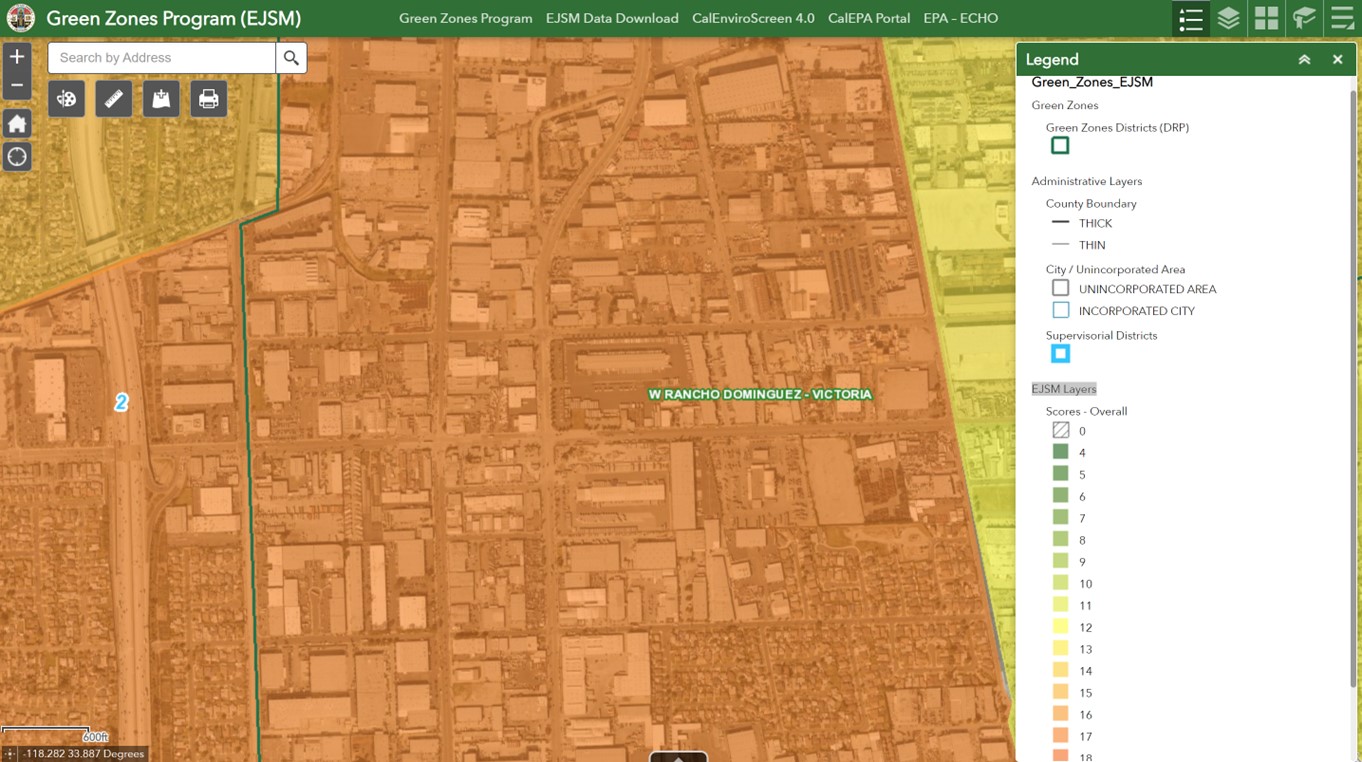
Green Zones are an entirely different way to look at zoning. It is an outgrowth of the Environmental Justice Movement that had its local origins addressing diesel exhaust at the Port Complex in San Pedro Bay. Properties are analyzed and graded based on their contribution to health disparities using the Environmental Justice Screening Method (EJSM). The EJSM is a new tool and strategy that is designed to correct unhealthy conditions by establishing new mitigation mechanisms. The County will use the EJSM for ongoing monitoring and annual reporting to the parcel level.

Depending on the EJSM score, Regional Planning offers four (4) different routes to approval. The simplest is Site Plan Review (SPR) and it is approved administratively in what we use to call, “over the counter”. The other three routes are discretionary and require formal application and Public Hearing at different levels of planning authority. Generally, the greater the health impact, the longer the approvals.
Continue reading “Leasing Industrial Property in Los Angeles County Under the New Green Zone Ordinance”